2021 Performance Review (Part 11)
Posted by Mark on April 29, 2022 at 06:46 | Last modified: February 16, 2022 13:36To conclude this mini-series, I offer the annual time frame along with some additional miscellany still germane to my pursuit.
Here is my performance by year versus the combo benchmark:
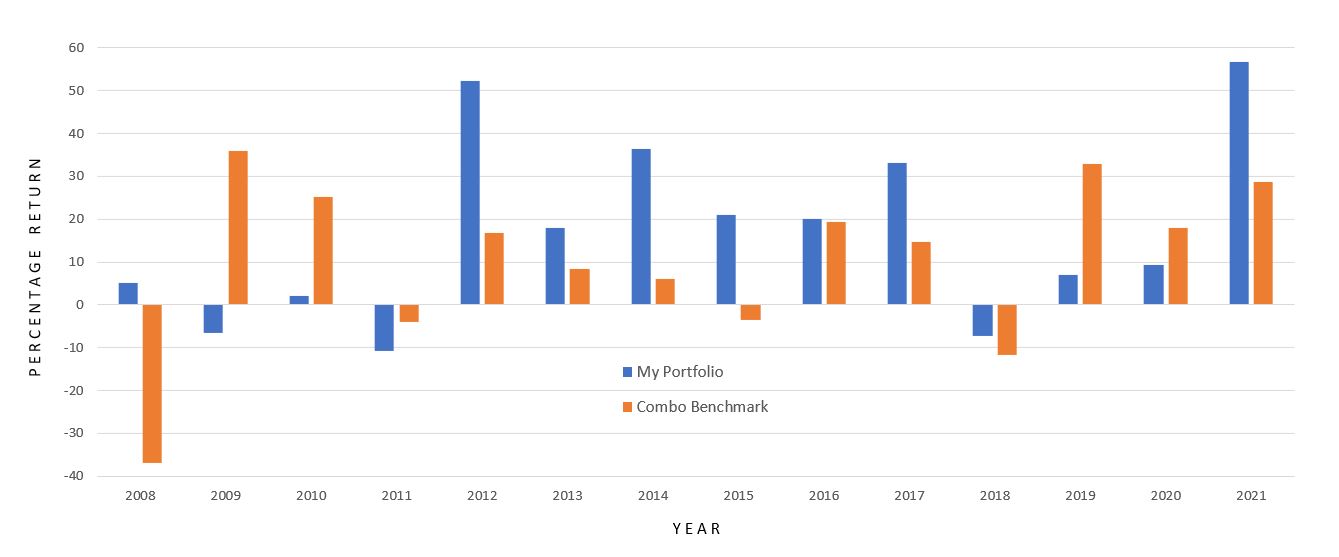
As mentioned in the second-to-last paragraph of Part 10, calendar years conceal my maximum drawdown. That is not the intent and the data must be sliced differently to show everything, which I have done.
My trading has taken several different forms over the years.
I assumed management of my personal brokerage account in 2001 and implemented stock-screening strategies I researched and developed. I had a decent first month but was hit by the 2001 correction thereafter. My stock investments were mostly short-term although I had a couple that went on to become spectacular long-term winners. Those played a large part in allowing me to leave my full-time job at the end of 2007.
In 2008, I began to trade options full-time. Making money in 2008 is one of my finest accomplishments. I changed strategy a few times over the first five years and suffered a couple catastrophic losses from which I was able to rebound, but the pain was certainly real (see this blog mini-series). The Big Question going forward was how I would navigate the periodic pain?
This review has updated my performance to include the last five years of trading. During that time, I phased out one brokerage account and started with another. For a couple years I was trading different strategies in the two accounts. 2018 included two 10% corrections in the same year and explosive volatility. I did some soul-searching because of the unlimited-risk nature of my approach, and I spent most of 2019 in cash backtesting and refining to address liquidity concerns along with absolute risk. Soon after jumping back into the market, I got an exit signal in Feb 2020. The hit I took was mitigated (see last sentence of this second paragraph) as the market proceeded to sell off an additional 27%.
The bar graph above reveals how much I missed in 2019 being mostly out of the market. 2019 could have conceivably been another 2021, which ended up as my best year ever. Sometimes it hurts to be on the sidelines.
Despite the pain, this blog mini-series provides an answer to the Big Question: quite well with benchmark outperformance in excess of 6% p.a. since 2008. I hope to continue outperforming going forward, but there are no guarantees. Making this happen will take some luck, some discipline, and lots of effort.
Thus concludes my 2021 performance review showing my live-trading experience with all its bumps, bruises, and scars: 100% out-of-sample data, to be sure. None of the backtesting I have done over the years has been included here.
Categories: Accountability | Comments (0) | Permalink2021 Performance Review (Part 10)
Posted by Mark on April 26, 2022 at 06:50 | Last modified: February 15, 2022 11:01I left off discussing my ugly 2013 speculative GC trading experiment gone awry. While I paid a lot in “market tuition” to learn some important lessons, at issue here is that the combo index benchmark does not include GC.
Including the GC trades artificially lowers my relative return if coincident GC performance is not incorporated to the benchmark. I’m tempted to just leave it because I believe in erring on the side of conservatism. That’s really not fair to me, though. Besides, as previously discussed I have already assessed the tax penalty on more than I actually made.
The following will result in a combo benchmark (RUT / GC / SPX) with the adjective “index” removed:
- My speculative GC trades run from 2/13/2013 – 5/17/2013.
- According to GC prices at execution, the futures drop from 1648.1 to 1359.6: -$288,500/contract.
- Futures margin during my largest position size is $5,400/contract (increased shortly thereafter per CME website).
- Futures options use SPAN margining, but I do not have historical data on the SPAN stress factors.
- With GC crash volatility, I would guess stress factors to be +/- 15% (if not 18% or more).
- At -15%, requirements are similar to the futures margin mentioned above; this allows me to calculate ROI.
- The combo benchmark performance is then a weighted average of GC and RUT.
- I lump all GC losses into Apr 2013, which is when my big portfolio drawdown (DD) occurred.
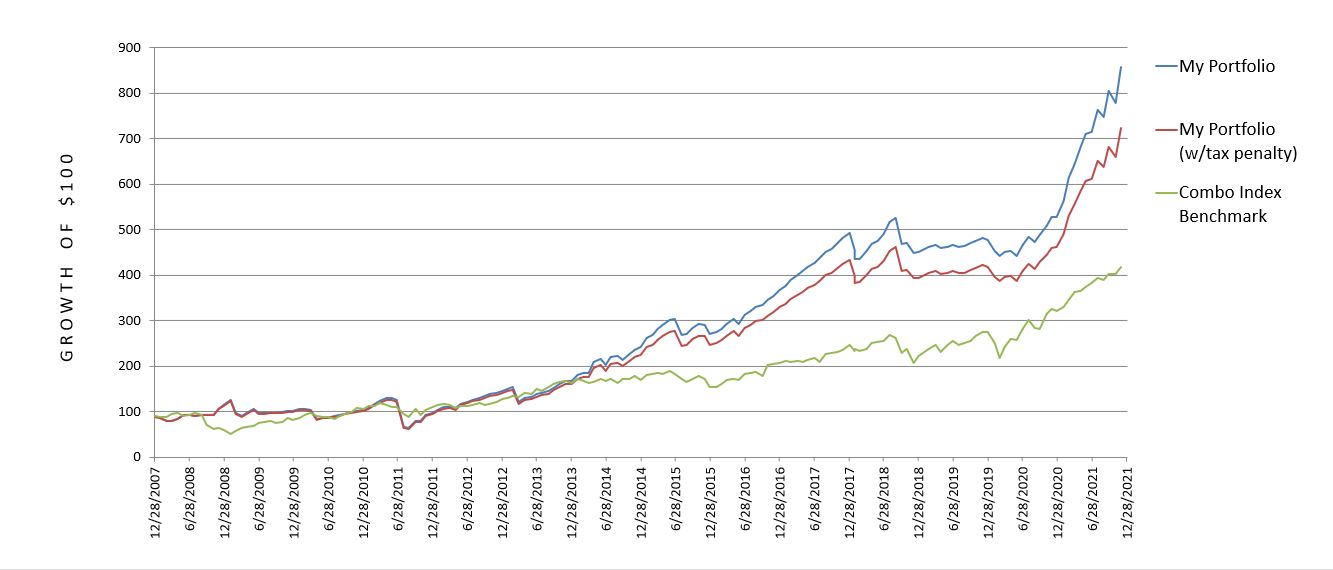
Here is the revised (compare with graphs shown in Part 7) 2008 – 2021 cumulative performance comparison:
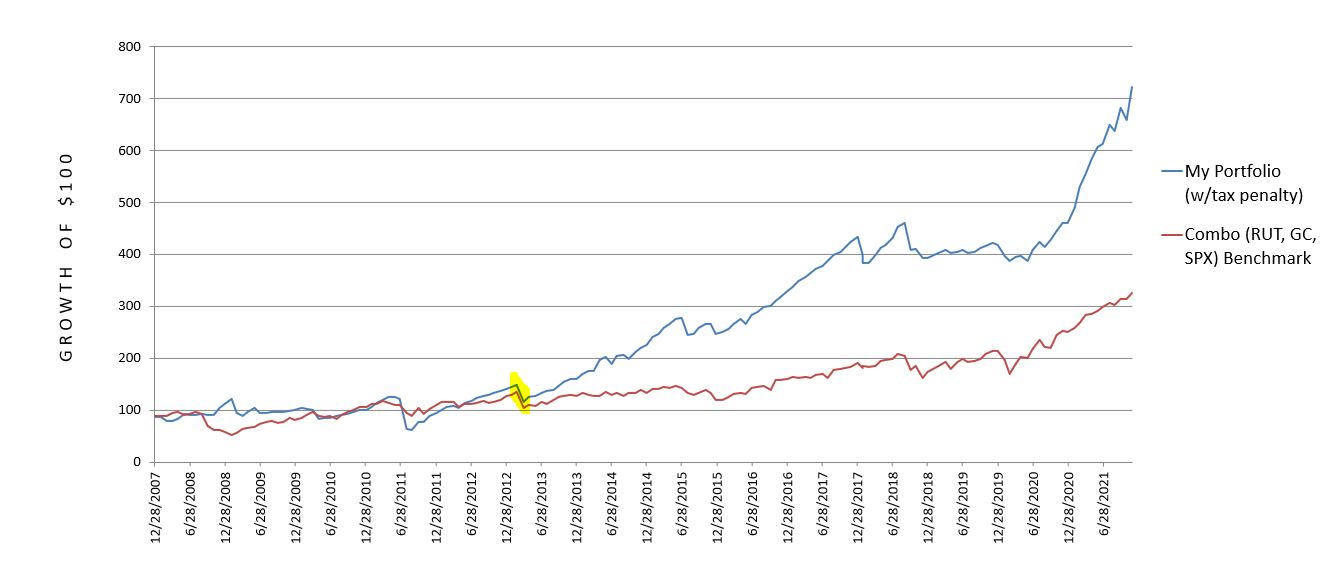
My annualized return remains at 15.17%, but the combo benchmark worsens from 10.75% to 8.80%. This boosts my outperformance from 4.42% p.a. to 6.37% p.a. and is a more accurate comparison.
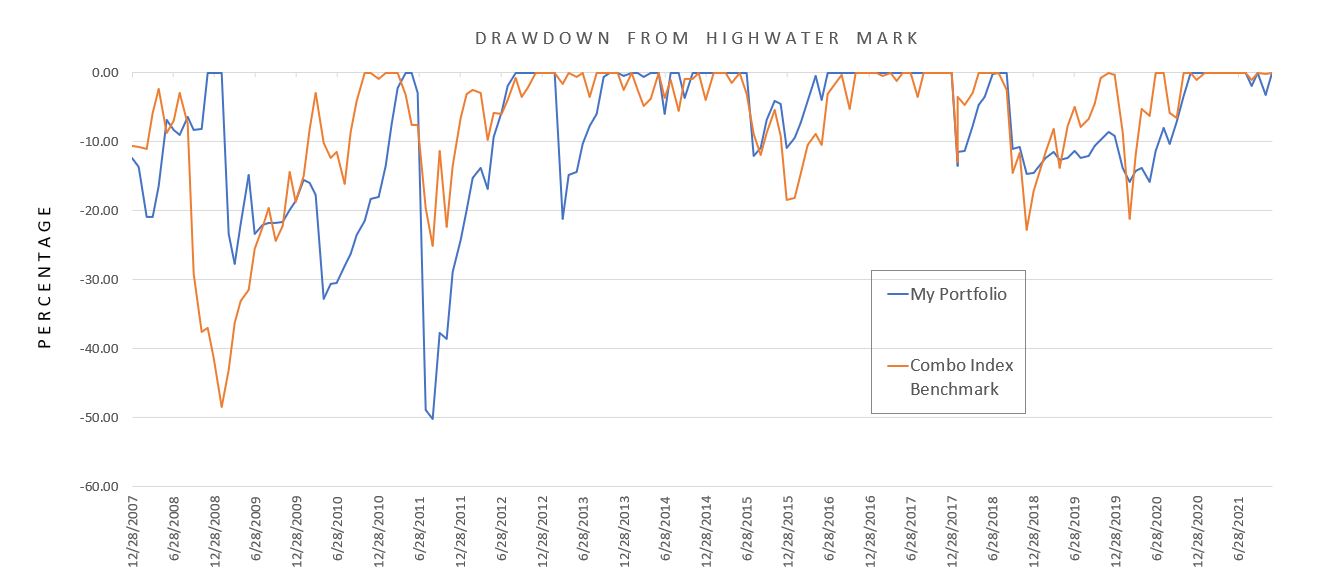
Here is the new DD comparison with major revision highlighted.
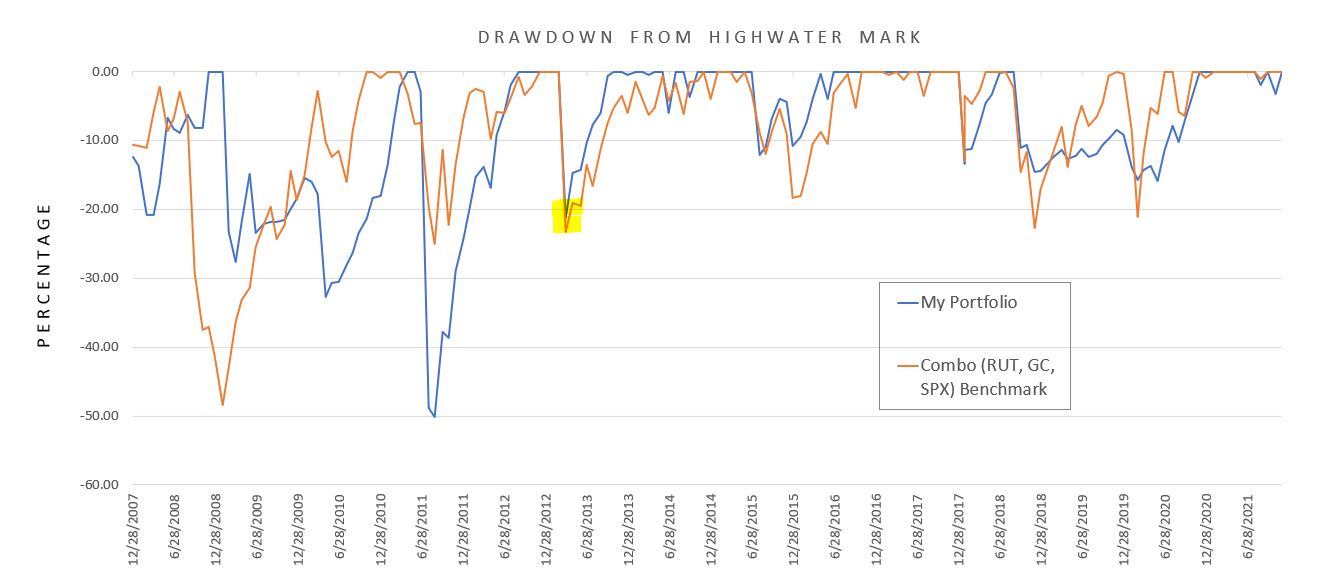
My mean DD remains at 8.86%, but the combo benchmark worsens from 7.17% to 7.92%. The max DD is unaffected.
I want to comment on something written here, which I was alarmed to see in preparing for the current performance review:
> I very much like the fact that my worst year was limited to just over a 10% loss.
> This is the kind of stability somewhat lacking to the upside. I experienced three
> catastrophic losses over the last nine years and the overall performance suggests
> I have bounced back quite well.
This is somewhat misleading. Yes, the look from a calendar-year perspective does speak to rapid recovery. It also paints a prettier picture than my current DD calculations that use a monthly time frame. Max DD of 50.10% for me vs. 48.39% for the combo benchmark better reflects the mental anguish suffered at the time.
I will continue next time.
Categories: Accountability | Comments (0) | Permalink2021 Performance Review (Part 9)
Posted by Mark on April 21, 2022 at 07:16 | Last modified: February 14, 2022 14:10I left off last time reviewing two of my largest drawdowns to consider whether such big losses might be avoided in the future. Nobody knows, of course, but while I’m at it I will take a look at one more that I completely overlooked.
In Apr 2013, I lost just over 21% when the combo index benchmark was down less than 2%. This is a unique situation because it happened in gold (GC). I was dabbling in some small trades just to get a feel for the market and I committed the fatal sin of doubling down and then basically doubling down again. This was particularly embarrassing because the equity market was doing fine—only a niche market paid attention by a few was getting destroyed, and I was part of the few.
Could a case have been made to exit now?
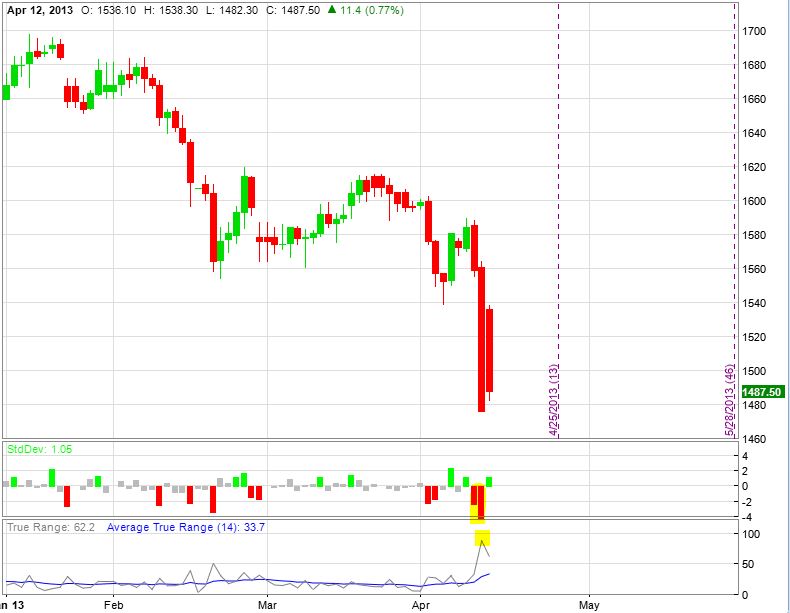
According to Reuters, this combined with the bloodshed during the next trading session was the worst 2-day gold rout in 30 years. I learned some powerful lessons from this (e.g. quit doubling down and mind stop-losses).
When things get crazy, I need to get out of the way. How to determine the craziness may not matter so much as just steering clear. Many potential indicators could be used with varying degrees of success.
You may have noticed my combo index benchmark (RUT and SPX) is not suitable for GC. I should probably correct this, and any correction will improve my relative performance. If I somehow integrate GC to the benchmark for a period of time, then the benchmark will suffer. Even if I underperform GC, GC significantly underperforms the benchmark portion it replaces.
I say “somehow” because determining how much to allocate to the GC trades is difficult. This is a leveraged, speculative [naked put] play that starts very small and goes horribly awry. The fairest way to proceed seems to be determining the margin requirement at max position size, and calculating the equity portion as a fraction of the total portfolio.
This experience scarred me to a point where I still have occasional trouble to this day. I will trade a new strategy in the smallest of size, which is good. When I take losses, though, then my interest wanes and I wait before trying the new strategy again (if ever). That is bad!
I feel quite confident to say this will not happen again. I no longer fight extra hard to avoid losses, and dramatically increasing trade size would be anathema to me.
As much as I might like to pretend the GC disaster didn’t happen, I certainly cannot justify excluding the trades because I saw them through and suffered heavy losses for which I should be held accountable.
I will continue next time.
Categories: Accountability | Comments (0) | Permalink2021 Performance Review (Part 8)
Posted by Mark on April 18, 2022 at 07:20 | Last modified: February 12, 2022 09:29I left off discussing drawdown (DD) statistics and my dissatisfaction with this aspect of my trading performance. My current maximum DD is the best it will ever be.
The DD [second] graph shown in Part 7 does suggest my risk management to be getting better. Since late 2013, benchmark pullbacks over 15% have been less for my portfolio: -11% vs. -18% in Jan 2016, -15% vs. -23% in Dec 2018, and -16% vs. -21% in Mar 2020. I may be even better on a daily basis than these end-of-month values reflect. In 2020 when SPX drops 34% (bottoming out on March 23), my account equity is down less than 12%.
I feel more risk-averse and cautious as I get older. This is a main reason why I made significant changes to my trading strategy in Dec 2018 to carry insurance at all times. Some people say as a mean-reverting asset class, volatility should be sold when high. A caveat is the rare case when “high” is a prelude to much higher: a chance I no longer wish to take.*
The big DDs are truly permanent losses and therefore worth some price (see this post) to avoid. My account can still reach a new post-DD high, but it won’t be as high as it would have otherwise been.
I’d like to present a few of the big drawdown periods along with the million-dollar question: is there anything I can do to avoid these kinds of equity drops?
In the May 2010 Flash Crash, I lose 32.77% with the combo index benchmark down 10.23%. I’ve heard a lot of traders say “the writing was on the wall” for this one. What do you think?
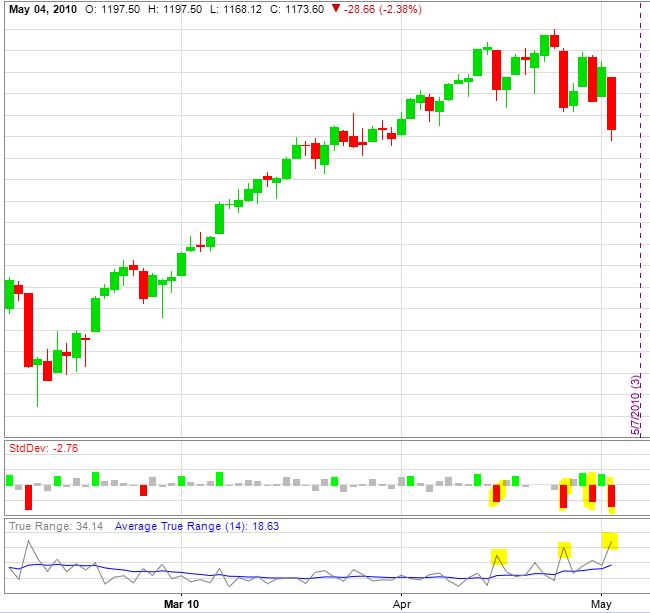
If this is going to be my signal, then I need to be ready to take action immediately. I should also be prepared for a near-term profit vacuum due to lag time before I get a full position in place once again.
On the upside: “cash is a position too.” On the downside: “opportunity cost, baby.”
At first glance, the volatility story ahead of the Flash Crash is somewhat equivocal. Only in hindsight is closing up shop and preparing for the worst an easy decision.
Aug 2011 is catastrophic with a loss just over 50% vs. the combo benchmark down half that. Do you see what comes next?
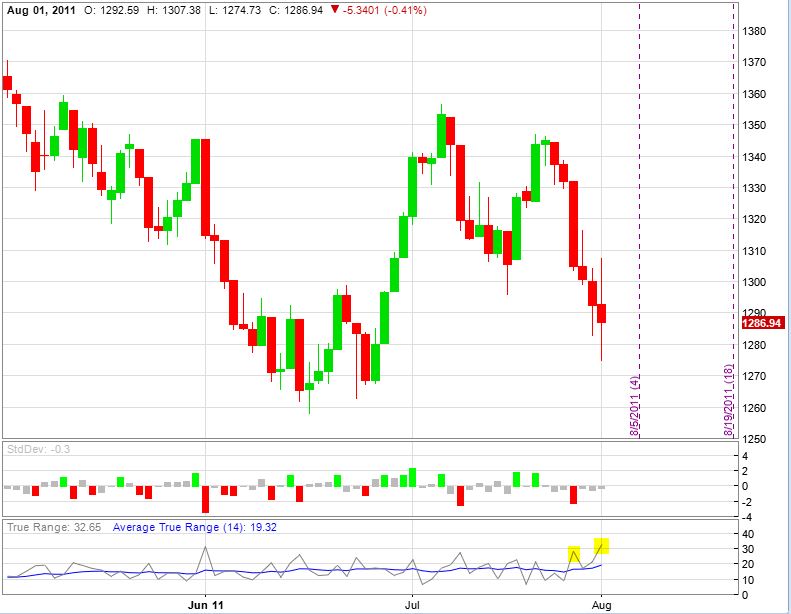
This is much less convincing to me from a technical standpoint. The volatility story, however, is unequivocal.
Neither of these are smooth sailing, per se, but if sufficient to sound the alarm then how many profitable opportunities will be missed and how will that affect long-term performance?
It bears repeating: only in hindsight is closing up shop and preparing for the worst an easy decision.
I will continue next time with one more case study.
* — The story may be different for a client who hires me to manage 10-20% of their portfolio
and target outsized returns knowing the most they can lose is a fraction of their total.
2021 Performance Review (Part 7)
Posted by Mark on April 14, 2022 at 07:22 | Last modified: February 10, 2022 17:45Last time, I decided to exclude results from my 2001 – 2007 stock trading years. I also settled upon a custom benchmark combination of RUT/SPX to more closely parallel my trading vehicles. I am finally ready to delve into the numbers.
Here is my performance record as a full-time option trader since 2008:
Since 2008, I have posted an average annual return of 15.17% vs. 10.75% for the combo index benchmark: outperformance of at least (see fifth-to-last paragraph here) 4.42% per year. A Motley Fool article from 2/1/22 writes:
> The S&P 500 gained value in 40 of the past 50 years, generating an average annualized return of 9.4%.
If sold, taxes are still due on these funds in the form of LTCG. The same is true for the combo index benchmark (green) and my red (penalized for active trading) equity curve.
My non-penalized (blue) equity curve simply shows taxes do matter (my annualized return would be 16.59% sans penalty). I think inquiring about tax implications and trading frequency is an integral part of due diligence on potential investment advisors (IA), money managers, or strategy vendors.
Pop quiz: does the blue curve apply if done in a Roth IRA?
Answer: please consult a tax professional for specifics about your individual situation. From my understanding, though, no tax liability remains on after-tax funds, which means the blue curve underestimates equity. The combo index benchmark still owes taxes in the form of LTCG (unless eligible for step-up at death, perhaps).
I would be elated to maintain benchmark outperformance of 4.42% p.a. if claims that most IAs underperform are true.
Total return does not tell the whole story, however. I believe drawdown (DD) is equally important for performance evaluation (see last paragraph here):
My maximum drawdown (MDD) is -50.10%, which is slightly worse than the benchmark’s -48.39%. That does not take place during the financial crisis, which I manage well. My MDD occurs in Aug – Sep of 2011 with the benchmark only down 25%. My average DD across all months is -8.86%, which is a bit worse than the benchmark’s -7.17%.
I am happy with my total return, but not so much with my DD statistics (risk management). Unfortunately, as part of the historical record I cannot improve on MDD. Going forward, I can work to exit sooner if I see signs of market turmoil. If the market falls more than 50.1% at some point and my portfolio falls less (or gains), then I can jump ahead on a relative basis in terms of MDD. These efforts may or may not succeed, though. There are no guarantees.
I will continue next time.
Categories: Accountability | Comments (0) | Permalink2021 Performance Review (Part 6)
Posted by Mark on April 12, 2022 at 06:38 | Last modified: February 9, 2022 15:12I left off last time with a big question: should I include my pre-2008 [mostly stock] trading as part of the long-term performance record? After sleeping on it, I’ve decided this question has no right answer.
A case can certainly be made to leave it in. It was me who researched and traded [stocks] back then. It’s still me who researches strategies and trades [options] now. I’ve learned things over the years: some for better, maybe some for worse—and who knows which of those things will be helpful or harmful going forward. It’s all the same person, though. It’s me.
As a candidate to manage money in an investment adviser capacity, one would have every right (and perhaps duty!) to look at my entire performance record. I am very proud of my time spent trading equities. That is what grew my account to a size sufficient for launching a full-time trading business.
Having said all this, I need to make a command decision.
Just because so many things are different from my option trading, I am leaving my pre-2008 trading performance out for the rest of this analysis. It was once presented here. I did not normalize for short-term trading (tax penalty), and I did not include benchmark dividends. At some future time, I may revisit and study the entire record again.
Going back to the third paragraph of Part 4, one question not addressed is whether 7% is a sufficient tax penalty in the first place. I definitely erred to the side of conservatism by charging the penalty on too much (see table), but is the penalty itself big enough? Look back at this table. Column 5 shows surplus tax for short-term trading. The actual tax incurred will move through various brackets up to that containing the actual AGI. 7% is higher than most values and sometimes significantly higher. It’s 1.8% lower than the third bracket, which only covers a range of $1,150 (column 6). It’s 1% lower than the seventh bracket, which is the second largest of all (~$250K range).
I think the best way to evaluate the penalty is to calculate a weighted average tax premium for short-term trading. This will be highest at $460,000 AGI where the [column 5] weighted average is 6.33%.
Once again, the penalty is more than sufficient.
The last consideration I want to make before delving deeper into the numbers is determination of the proper benchmark. From 2008 through Dec 2018, the bulk of my trading was done in RUT. I switched to SPX in Dec 2018. I will therefore construct one index benchmark, which will be a combination of these two. As I assume this to be a buy-and-hold benchmark, all considerations regarding the tax penalty remain the same.
I will continue next time.
Categories: Accountability | Comments (0) | Permalink2021 Performance Review (Part 5)
Posted by Mark on April 7, 2022 at 06:48 | Last modified: February 9, 2022 15:17I left off suggesting a revision to my global tax penalty for short-term trading, which will hopefully allow me to err conservatively while not diminishing my performance too much.
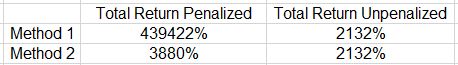
Rather than penalizing every positive month (method 1), what happens if I penalize only those months resulting in a new highwater mark being reached (method 2)?
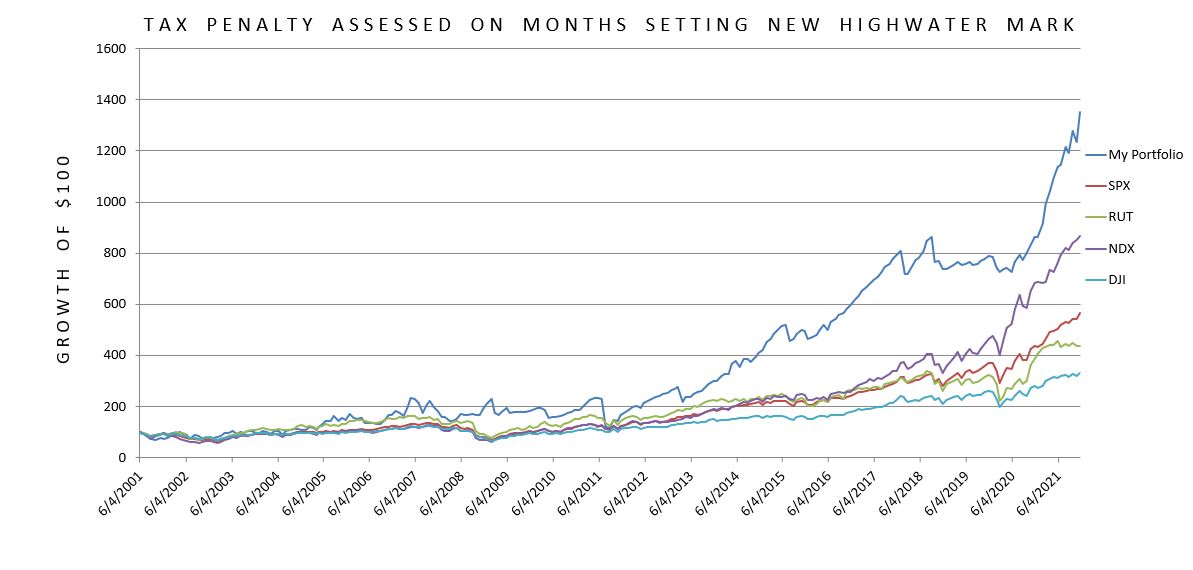
Done this way, I still come out ahead of the set of index benchmarks. To check my work, I multiply together the returns of all penalized months. I do not include the penalty itself because the intent is to determine what total return is being penalized.
Here is a comparison of method 1 and method 2:
Despite sounding reasonable, even method 2 penalizes too much. I think this happens for two reasons.
First, method 2 does not mind the edges. Suppose the highwater mark is 1048 and last month closed at 1000. If I gain 5% this month, then I achieve a new highwater mark (1050) by 0.19%. Method 2 assesses the tax penalty on the full 5%, however. That’s a big discrepancy.
Second, method 2 evaluates the highwater mark monthly rather than annually. Suppose for the first 11 months of a year, I make 3% each month only to lose 28% in the last month. In actuality, I end up down 0.3% for the year and would owe no tax. Method 2 would assess a tax penalty on 1.03 ^ 11 ~ 38%. That’s another big discrepancy.
I could resolve this by removing the penalty on select months to bring that 3880% closer to 2132% thereby lessening the overcharge. This would be completely legitimate, but for now I will resist the temptation. I can at least feel confident knowing I have insurance against some unforeseen oversight that might result in my performance numbers being artificially inflated.
In the end, if I [overly] err on the side of conservatism and still come out smelling like a rose, then my ultimate goal is achieved. I may be off to a good start because at first glance, the graph above has me sitting comfortably on top.
I still have a couple other things to address with the first being stock versus option trading. I mentioned in the second paragraph here a bit about the different types of trading I have done over the years. 2008 seems to be a major demarcation for two reasons: this is when I started trading full-time as well as when I started trading Section 1256 contracts.
Here’s the big question: should 2001 – 2007 be included in the analysis or left out?
That is something I will be sleeping on tonight.
Categories: Accountability | Comments (0) | Permalink2021 Performance Review (Part 4)
Posted by Mark on April 4, 2022 at 06:37 | Last modified: February 8, 2022 16:55I left off discussing the inclusion of a tax penalty given that my trading is short-term whereas the benchmark indices represent long-term buy-and-hold. How to err conservatively in such a way to spare myself the task of having to look up every tax code change since 2001 and the precise tax rates that accompanied them?
The answer is to determine an across-the-board tax penalty high enough to cover most months even if it ends up being a bit too high overall.
Let’s work from the 2021 tax rates table I composed in Part 3. Since I like to be optimistic and visualize maximum profits, I will use the highest tax bracket with 20% LTCG and 37% tax on ordinary income (short-term). As a blended 60/40 tax rate: (20% * 0.6) + (37% * 0.4) = 26.8%. Rounding up, that is a 7% higher tax rate than LTCG for a buy-and-hold benchmark. I will therefore multiply the monthly return by 0.93 anytime my portfolio posts a profitable month.
I was not trading Section 1256 contracts before 2008. That tax penalty is 37% (being optimistic so as to assume maximal tax rate) minus 20% = 17%. I will therefore multiply each profitable month from 2001 – 2007 by 0.83.
Compare this closely with the graph shown in Part 2:
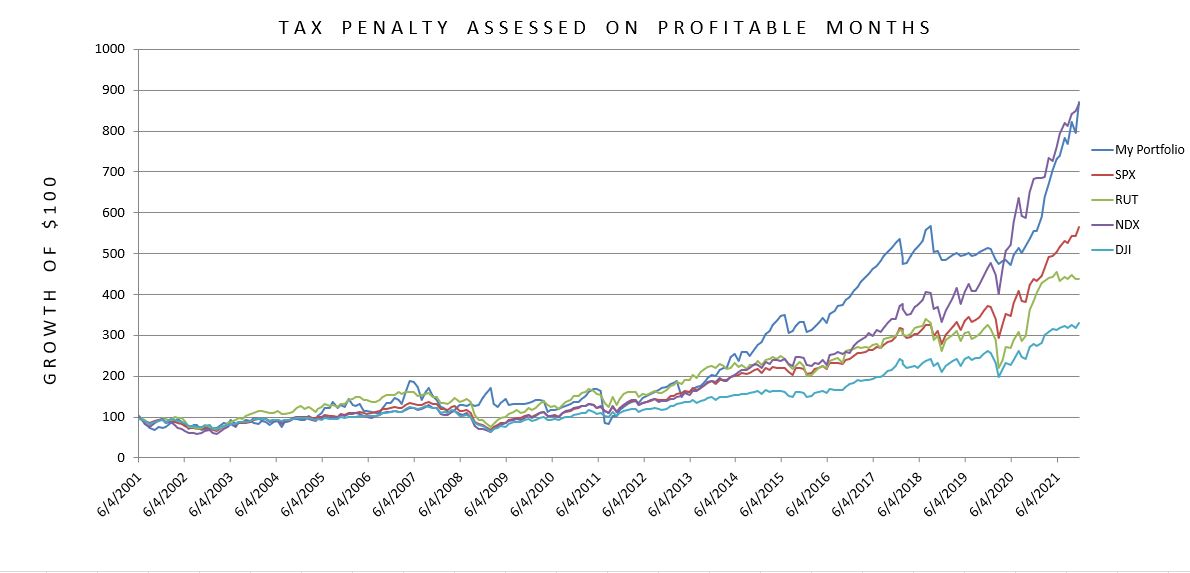
Big difference! My cumulative return has been cut from 2,032% to 771%. Furthermore, my trading edge over a set of major indices has all but evaporated.
To check my work, I multiply together all the positive months to get the cumulative return. This represents the profits on which a tax penalty has been assessed. The previous graph showed this cumulative return to be 2,032% sans tax considerations. Here, the cumulative return is 439,322%.
By charging myself the tax penalty on all positive months and giving no credit for negative ones, I overshoot by a huge margin! No wonder the trading edge is nullified.
This business is tricky because while I’m all about erring to the side of conservativism (as discussed in Part 2), I don’t want to be so conservative that I fool myself into believing I have a losing or mediocre trading strategy when in fact it may be decent or good. Depending on how one looks at it, statistics deems this a type I error (false positive) or type II error (false negative): neither of which is advised. In this case, I penalized myself far more than I should have for short-term trading.
Going back to the second paragraph above, let’s fine-tune this by changing the last sentence. Rather than penalizing all positive months, I will penalize months where the final account value makes an all-time high. This is much more realistic. When my year-end account value is higher than the previous year-end account value, I pay taxes on that profit. If the year-end account value is lower, then I pay no taxes and the losses carry over to offset profit (at least partially) in future years.
This is really where I should tell you to consult a tax professional for specifics since your situation may vary.*
I will continue next time.
* — I might also suggest exploring trading as an entity if you are more active.
2021 Performance Review (Part 3)
Posted by Mark on April 1, 2022 at 07:04 | Last modified: February 8, 2022 11:19I left off presenting a comparative graph of my trading performance versus the major indices from 2001 – 2021. The graph is best considered a rough draft, though, for a couple different reasons.
My trading has significantly changed over the years. From 2001 – 2006, I researched systematic criteria and used those to pick stocks. In 2007, I started trading equity options, and in 2008, I went full-time trading [mostly] index options. Even for the latter, my option strategies have evolved. I could make a case to completely separate out 2001 – 2007 but for now, just realize the graph does not portray performance of one fixed strategy over two decades.
I think the main thing masked by the graph has to do with taxes. Disclaimers I hear over and over include things like “please consult a tax professional,” “everyone’s tax situation is different,” and “your results may vary.”
Performance shown by the Part 2 graph could conceivably be achieved in a Roth IRA with after-tax money.
More likely, though, much of this trading is done in taxable accounts and for that reason, I want to do what I can to normalize the comparison between my portfolio and the benchmarks. What I am not looking to present are after-tax returns, which [per disclaimers above] may not be applicable to a heterogeneous audience.
I assume the benchmarks to be buy-and-hold [over 12 months] whereas my trading is generally short-term. The former qualify for long-term capital gains (LTCG) tax rates whereas the latter gets taxed as ordinary income. For the same reasons to err conservatively discussed in the last post, I feel hiding this would be deceptive.*
Although short-term, my trading does qualify for the blended tax treatment afforded to Section 1256 contracts where 60% the profits are taxed as long-term. This is still complicated because one’s total net worth dictates position size, which dictates magnitude of profits [or losses], and subsequently tax rates.
Here are the numerous tax-rate combinations of LTCG (second column) and ordinary income (third column) for 2021:
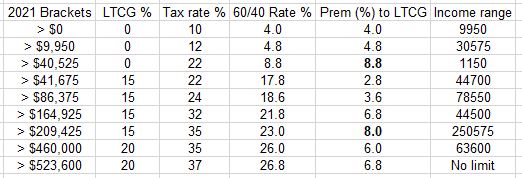
The fourth column sums 60% of the second column and 40% of the third column. The fifth column shows by what percentage the ordinary-income tax rate exceeds LTCG. The sixth column shows over what range of income this differential applies.
To make matters even more complex, tax rates have changed over the years. Aiming to err on the side of conservatism spares me from having to hunt down all tax-code changes to apply for each respective period.
I will explain this next time.
* — I do believe many financial professionals hide it, though, because it
may be easily swept under the mat with disclaimers as given above.
2021 Performance Review (Part 2)
Posted by Mark on March 29, 2022 at 06:47 | Last modified: February 8, 2022 11:23Last time, I began to lay the groundwork for a long-term performance review. Today I will continue the discussion.
My hopes for doing this in Python resulted in the project dragging on for a couple extra weeks until I finally decided to stick with my original Excel spreadsheet, which had data from 2001 – 2016. The first thing for me to do was to complete this through 2021. The first few months of the spreadsheet looks like this:
![]()
Eventually, I started adding the last Friday dates for the beginning and end of the monthly periods to make lookup quicker.
After entering the monthly performance of my portfolio through 2021, I calculated monthly performance for SPX, RUT, NDX, and DJI. As the spot indices do not include dividends, I fetched historical dividend yield data from http://www.multpl.com/s-p-500-dividend-yield/table for SPX and https://www.macrotrends.net for the other three. On the latter website, IWM and QQQ yields are provided quarterly and DIA yields monthly. For each data series, I took the highest value for all four quarters (or 12 months) and used that as the dividend yield for the entire year.
As a result of this conservative manipulation, the benchmark return is slightly enhanced and my comparative trading performance will be weaker. I prefer to err on the side of conservativism (see sixth paragraph here and last full paragraph here) just in case I’m ever caught wearing the rose-colored glasses without my notice (e.g. sixth paragraph here).
I also seize the opportunity for conservatism in my handling of missing QQQ yield data. No data are available prior to 2006. I therefore plugged in the highest quarterly yield recorded from 2006-2021 for 2001-2005. The gist of all this is to weaken my results when reasonable to do so. If I still come out shining bright then it may be a significant finding. I feel the same way about backtesting performance: bias against backtesting results in every way possible such that if the results still pass muster, I may indeed be looking at a viable trading candidate.
I have discussed critical analysis many times (e.g. third-to-last paragraph here). To believe something is worthwhile in this industry, performance results should be impressive beyond a reasonable doubt. Make sure to include the headwinds because you can be sure Mr. Market won’t forget them (see fifth-to-last paragraph here) at the hard right edge of the chart.
Here’s a first look at the performance comparison:
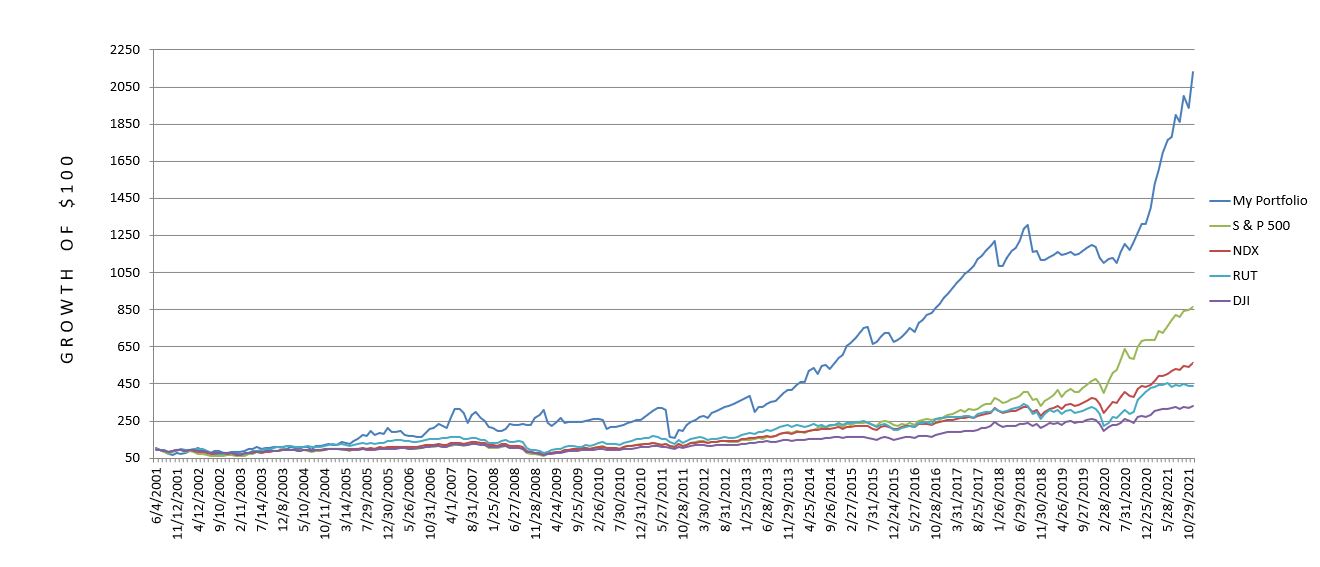
I will continue next time.
Categories: Accountability | Comments (0) | Permalink