Naked Put Study 2 (Part 3)
Posted by Mark on November 7, 2016 at 07:46 | Last modified: January 27, 2017 14:24I left off with a drawdown (DD) analysis of my second comprehensive naked put (NP) study.
I believe DD analysis should be applied to any trading strategy. Even without the second table of trade statistics, DD analysis could be done in a few easy steps. First, note the starting equity on the left edge of the graph. Second, measure the largest DD (vertical drop in the chart). Third, compare the two:
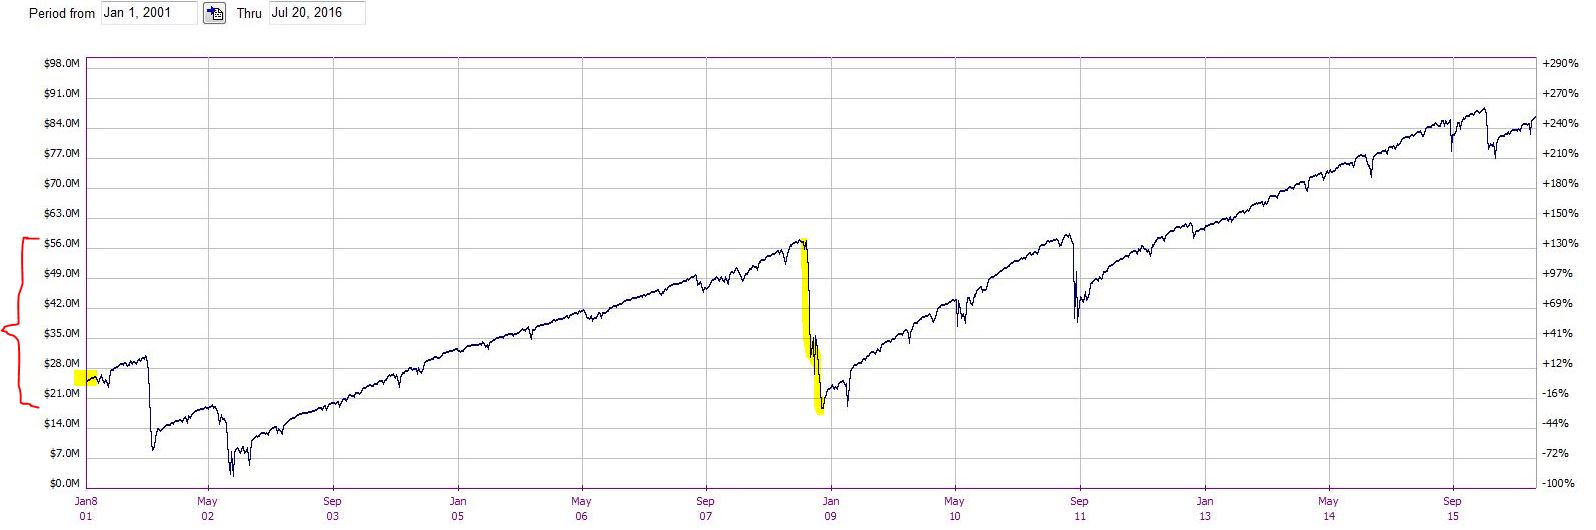
The bracket in red on the left margin translates to the 2008 financial crisis, which is the max DD. This is clearly more than the starting equity of $25M. To me, this shouts “danger!” It was just a matter of luck that the DD did not occur earlier else this account would have blown up.
I believe leverage is important to monitor in case of worst-case scenario: a gap down to zero on the next trading day. Nothing close to this has ever happened but Federal/FINRA regulations acknowledge the possibility. I added $5M notional risk per day and the average days in trade was 36.52, which means at any given moment the amount of risk is roughly 365 * $5M * (36.52 / 365) = $182.6M. This equates to an initial leverage factor of about 7.3. By the end it had fallen to 2.3.
A performance graph of NPs (red line) versus long shares (blue line) is revealing:
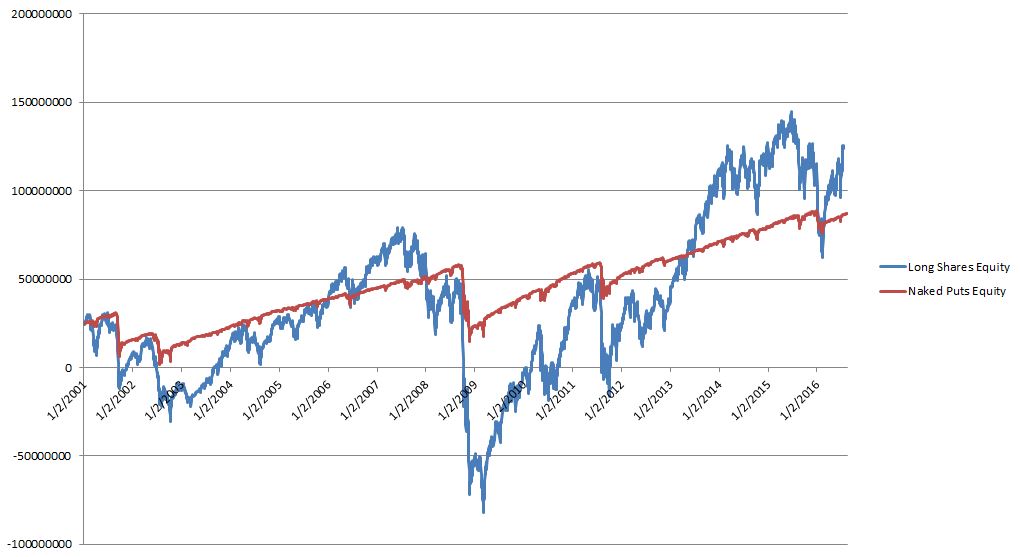
Both lines start at $25M, which is the initial equity of the account. The long shares generated more profit than NPs as evidenced on the right side of the chart.
I mentioned above that DD analysis should always be done and this is because DDs are responsible for catastrophic loss. Clearly in this case the long shares trade is not something anybody could bear. The max DD is longer in length (2187 days vs. 1000 days) and larger in magnitude ($161M vs. $43.4M) than NPs. The long shares account also goes bust: several times (2001-2003 and 2008-2011)!
Calculating risk-adjusted returns leaves long shares trailing NPs by a wide margin. Using DD as our measure of risk and realizing that the max DD is 3.7x larger for long shares, normalizing for risk lowers the net profit of long shares to $27.2M, which is only 44% the net profit of the NPs.
The argument that options are better than stock is alive and well here.
The observation that the NPs were down money after the first eight years, however, leaves me wanting something more.
Comments (3)
[…] the root of my last post but never explicitly stated were those darned emotions of fear and […]
[…] completed an initial comparison between naked puts and long stock, I now begin the process of trying to determine how I might be able to improve this […]
[…] best analysis I have between long shares and NPs may be the second graph shown here. In that analysis I did not calculate the total but using my naked eye and this online calculator, […]