Time Spread Backtesting (Part 2)
Posted by Mark on December 27, 2022 at 06:25 | Last modified: June 23, 2022 14:26Last time, I began easing into time spread backtesting with my Python automated backtester by discussing trade verification. Before getting into that, I need to flush out a couple bugs in the program.
Because sudden equity jumps in the first graph may be seen as other anomalous prints on the other three graphs, I will begin with the three outlier position prices seen on the second graph. The first appears to be ~$30 around the beginning of Apr 2013. As an original price, this should be visible in the summary file:
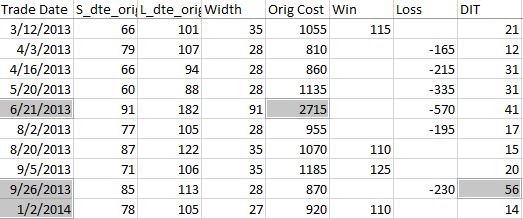
Although the trade in question is obviously from 6/21/13 ($27.15 * 100/contract = $2,715 original cost), it plots closer to the beginning of Apr 2013. I think the problem is everything I did here with regard to “plots the evenly-spaced date labels at evenly spaced locations on the x-axis.” Unfortunately, the trades are not evenly-spaced. Although I want the tick marks to be evenly spaced in time and distance across the graph, I want the x-values of the points to correctly match the x-axis.
This will need fixing.
Another problem regards the final trade of 2013 beginning Sep 26 and lasting 56 days. Rounding off, the next trade should begin around Nov 26 (two months later). Surprisingly, the next trade does not begin until Jan 2, 2014. What happened?
I am tempted to think any open trade at the end of a year gets erroneously junked in favor of a new trade beginning first trading day of the following year due to an iteration technicality.
However, the anomaly does not seem to reduce to anything that consistent. It does not repeat for 2014 (trade ends Dec 19 with next trading starting Dec 31). It is not applicable for 2015 (Dec 22 trade correctly carries over to Jan 7, 2016) or beyond. Going backward from 2013, the anomaly does present in 2012 and in 2010.
To pin this down more accurately, I replaced the Trade Date column in summary_file with Trade Start and Trade End columns. In Excel, I then subtracted the previous Trade End from Trade Start and sorted this Date Diff column from highest to lowest. Because I was missing the previous trade ending date, I inserted that as a new column making sure to Paste Special by values to prevent sorting triggering a recalculation:
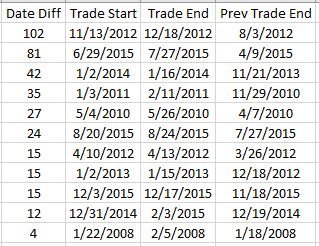
Date differences of four or less are within normal limits. One would be a new trade starting on a weekday after the previous trade ended yesterday. Two could be a weekday market holiday such as Independence Day coming in between. Three would be a new trade starting on a Monday after the previous trade ended on Friday. Four would be a trade ending on a Thursday or Friday with new trade starting the following Monday or Tuesday due to a Friday or Monday market holiday.
I could even stretch to explain a five in case the market were closed for an extended period. For example, due to Hurricane Sandy the markets were closed Monday, Oct 29, and Tuesday, Oct 30, 2012.
As shown above, the list skips from four straight to 12. This defies any explanation. If the data files are clean, then I expect entries and exits on back-to-back trading days every single time.
There’s something going on…
Categories: Backtesting, Python | Comments (0) | PermalinkTime Spread Backtesting (Part 1)
Posted by Mark on December 22, 2022 at 06:39 | Last modified: June 13, 2022 14:30Bumps and bruises are still to come along the road ahead, but Version 14d of my backtester is at least somewhat functional. I am now ready to start presenting and interpreting results.
Let’s start with something very basic. In rough terms, SPX_ROD1 time spread strategy is as follows:
- If flat, then open one contract with short leg 2-3 months to expiration and long leg 4-5 weeks farther out in time.
- Exit trade if ROI% > +10% profit target or ROI% < -20% max loss.
Here are the results:
- 257 trades
- 196 winners (~76%)
- Average profit $221
- Average loss $383
- Profit factor of 1.86
In case this seems like a legit backtest, be aware of some things that are missing:
- Trade verification
- Exploration of time stops
- Exploration of alternative exit levels
- Max excursion analysis
- Drawdown analysis
- Position sizing
- Transaction fees
Looking at a summary line in isolation hides a lot of critical information. Things like cost, DIT, width, closing PnL—pretty much anything, really—should be evaluated in relation to surrounding trades to reveal potential errors. I may have coded incorrectly, or I may have a corrupt data file. I have not done my due diligence if I can’t verify by looking through a trade one day at a time to check for reasonable consistency. This isn’t to say I need to look through every trade in every backtest every time, but I should at least do some periodic spot checking.
I already have some means to do this spot-check verification. I have two output files with summary and intratrade statistics as well as four graphs [shown below in two separate screenshots] that I spent a lot of time debugging (e.g. this mini-series):
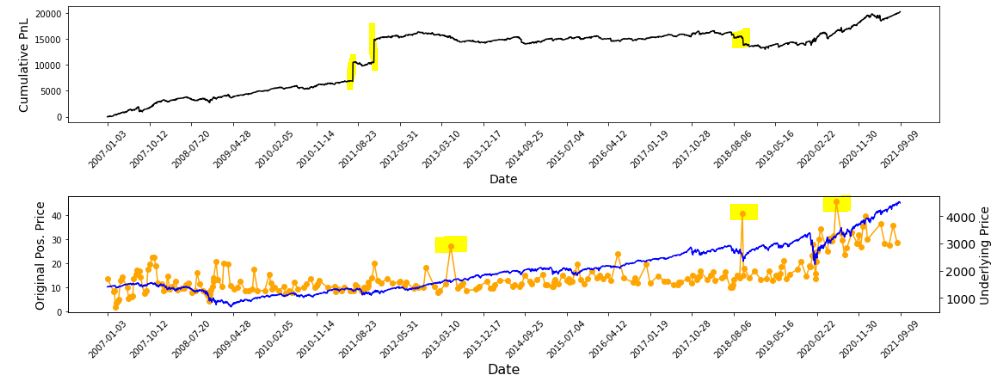
The first graph is an equity curve. Any sudden jumps are things that I want to inspect. I have highlighted three. I remember summer 2011 as a volatile market. I’m not sure about mid-2018. I will take a closer look at the trade log.
The second graph shows trade prices in orange. Any significant spikes are worthy of investigation to make sure nothing more than isolated volatility is responsible for the short-term outlier. I have highlighted three spikes on the graph.
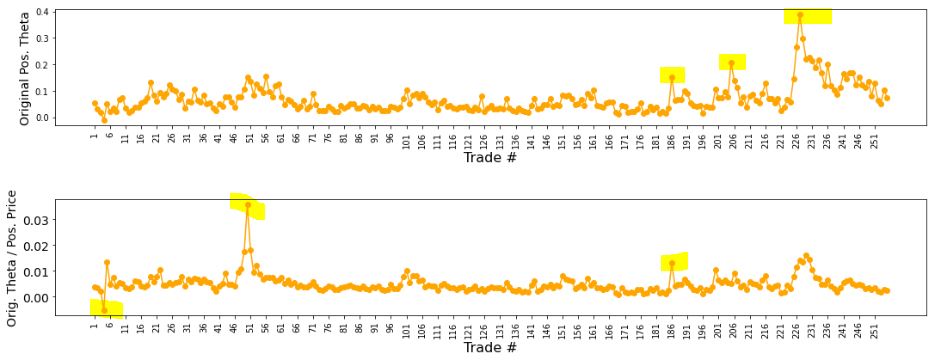
The third graph shows position theta at trade inception. I have highlighted three spikes worthy of a closer look.
The final graph normalizes initial position theta by trade cost. I have highlighted three spikes that are worthy of investigation. The first of these is clearly below zero, which suggests either theta or cost starts out negative. I can hardly imagine either one of those given accurate data so I definitely want to analyze that.
I will continue next time.
Categories: Backtesting, Python | Comments (0) | PermalinkTime Spread Backtesting 2022 Q1 (Part 9)
Posted by Mark on September 1, 2022 at 06:49 | Last modified: May 18, 2022 17:16Today I will conclude my time spread backtesting for 2022 Q1.
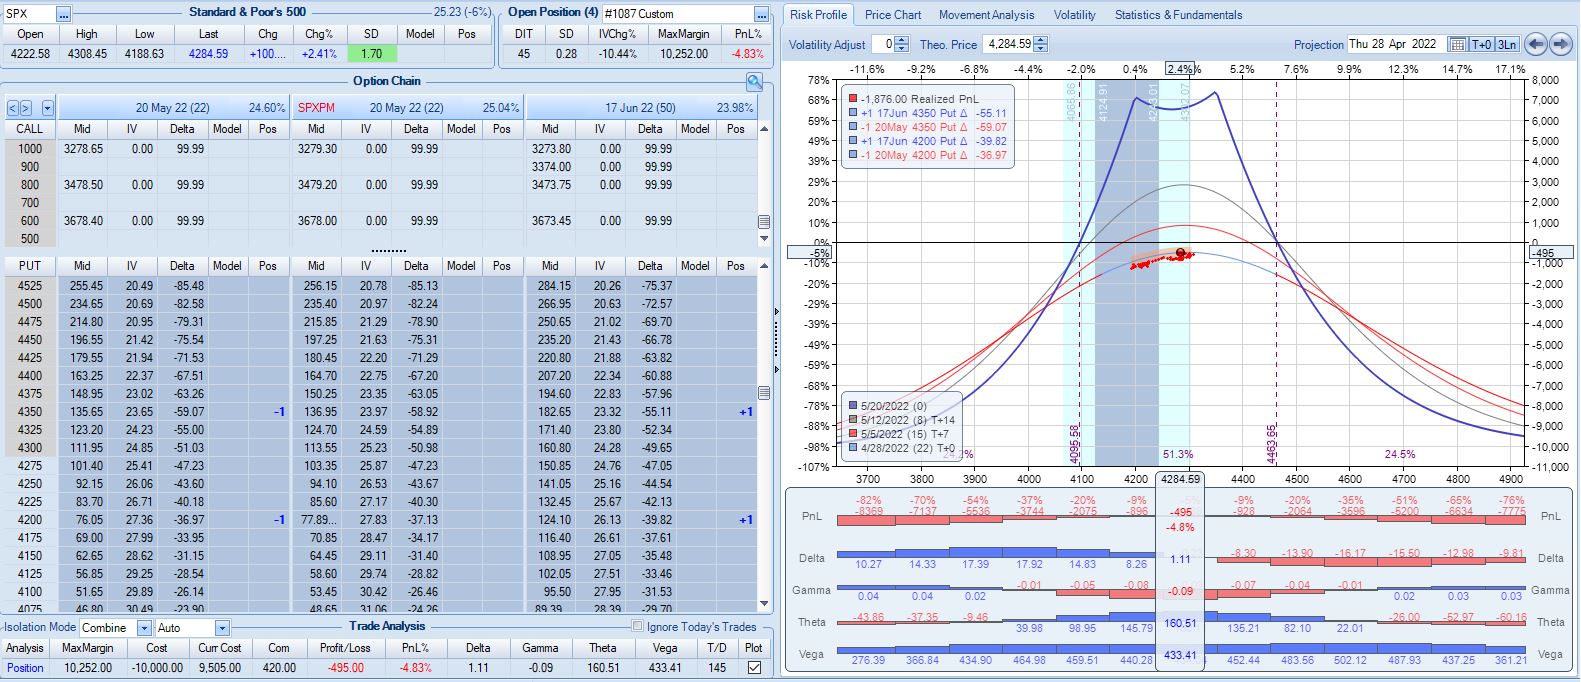
I left off at the second adjustment point of trade #14. Pre-adjustment, this is very close to max loss.
Whether the mere act of adjusting makes ROI% better or worse is simply a matter of arithmetic. The first adjustment worsens ROI% from -7.4% to -8.1%. The second adjustment improves ROI%. MR increases by $1,388, which is a bigger change than that resulting from the first adjustment (+$568). PnL pre-second-adjustment is -19% vs. -7.4% for the first, though. To maintain ROI%, the larger MR would have to be accompanied by a loss that is $263 higher. Transaction costs are fixed at $21/contract, which is $84/adjustment. Because $84 < $263, the second adjustment dilutes ROI% back to -16.8%:
At this point, TD = 11. According to ONE, I only have ~1% of downside before -20% max loss is reached.* Is the adjustment worth doing? Certainly in the absence of a guideline preventing it (see base strategy in Part 1), I have to say yes.
Max loss is hit at -21.4% four days later on a 2.12 SD market decline. For the trade, SPX falls 1.88 SD over 29 days although it’s only down 1.34 SD over 28. Unpredictability of large moves is one reason this endeavor can be so difficult.
In total for 13 trades entered in Q1,** the base time spread strategy makes $1,855 on a max margin of $10,252. The latter also represents the greatest increase from initial capital (+45%) seen in 158 historical trades. Although it’s probably far more than I need, I like to err on the side of conservatism. Doubling the $10,252 will provide for a substantial margin of safety.
The time spread return is therefore +9.0% for Q1 2022 compared to -12.8% for SPX. That is a shellacking with which I would be quite satisfied (compare here). The overall PF is low (but profitable!) at 1.28. The average win (loss) is $938 (-$1,647) on 9 (4) total wins (losses). Over just 13 trades, the max consecutive number of wins vs. losses is two vs. eight, respectively: pretty healthy [for equity curve to hang out near all-time highs most of the time]. Those two started out the year, though, which made for what would ultimately be the max drawdown (MDD) of -15.7%.
Rounding up to four total months of backtesting, the annualized time spread return is +27%. As always, don’t count on any good result repeating every year.
Taking a normalization approach, MR for each trade can be divided into any fixed number you choose to get position size. The PnL numbers then turn out slightly different. Normalizing for $100K, I get a Net PnL of $21,541 (+21.5%) and a PF of 1.21, which is slightly worse than without normalizing (heed the less-impressive result). MDD after the first two trades is about -49%. That’s way too high for my risk tolerance. MDD would be -19.6% if normalized for $250K MR. I find this more reasonable. At this level, total return falls to +8.6%, which is +25.8% annualized.
* — The automated backtester would not have access to this information.
** — 14 includes trade #3 starting 3/9/22 and trade #11 starting 3/7/22. I took the worst
of the two since both occurred in the same week.
Time Spread Backtesting 2022 Q1 (Part 8)
Posted by Mark on August 18, 2022 at 06:40 | Last modified: May 18, 2022 14:17I will begin today by finishing up the backtesting of trade #12 from 3/14/22.
The next day is 21 DTE when I am forced to exit for a loss of 16.5%. Over 46 days, SPX is down only -0.09 SD, which is surely frustrating as a sideways market should be a perfect scenario to profit with this strategy. I am denied by an outsized (2.91 SD) move on the final trading day. Being down a reasonable amount only to be stuck with max loss at the last possible moment will leave an emotional scar. If I can’t handle that, then I really need to consider the preventative guideline from the second-to-last paragraph of Part 7 because the most important thing of all is staying in the game to enter the next trade.
One other thing I notice with regard to trade #12’s third adjustment is margin expansion. The later the adjustment, the more expensive it will be. As I try to err on the side of conservativism, position sizing is based on the largest margin requirement (MR) seen in any trade (see second-to-last paragraph here) plus a fudge factor (second paragraph here) since I assume the worst is always to come. This third adjustment—in the final week of the trade—increases MR from $7,964 to $10,252: an increase of about 29%! The first two adjustments combined only increased MR by 13%.
The drastic MR expansion will dilute results for the entire backtest/strategy, which makes it somewhat contentious. To be safe, I would calculate backtesting results on 2x largest MR ever seen. If I position size as a fixed percentage of account value (allows for compounding), then I would position size based on a % margin expansion from initial. For example, if the greatest historical MR expansion ever seen was 30%, then maybe I prepare for 60% when entering the trade.
With SPX at 4454, trade #13 begins on 3/21/22 at the 4475 strike for $6,888: TD 23, IV 20.0%, horizontal skew -0.4%, NPV 304, and theta 39.
Profit target is hit 15 days later with trade up 11.8% and TD 21. After such a complex trade #12, this one is easy.
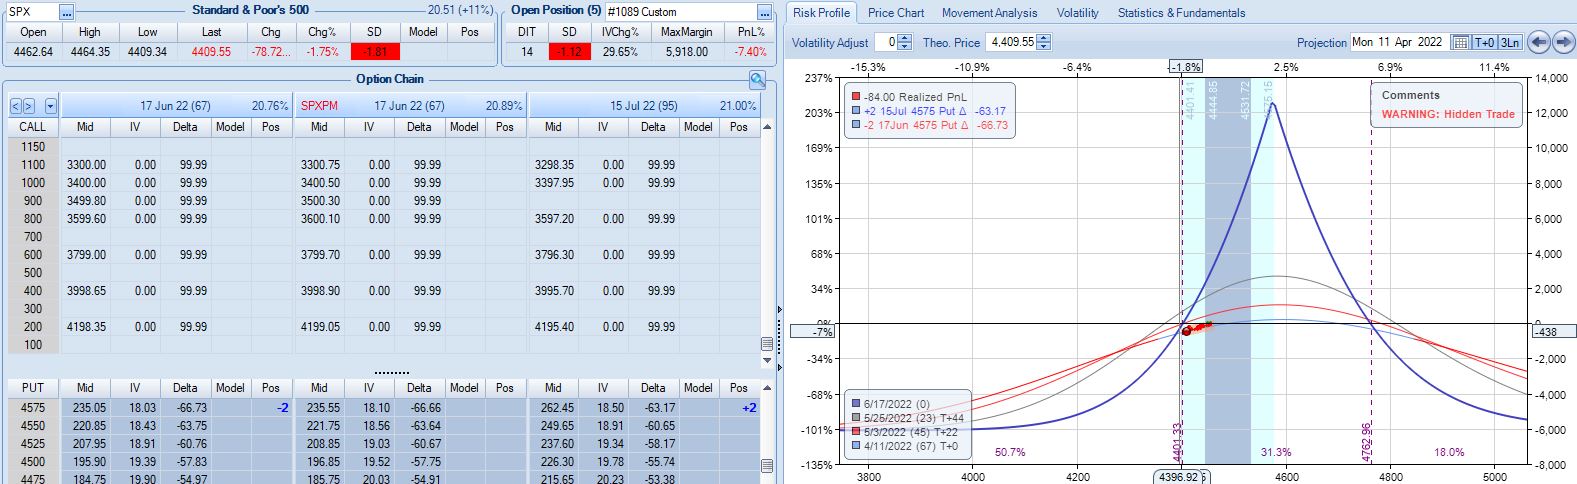
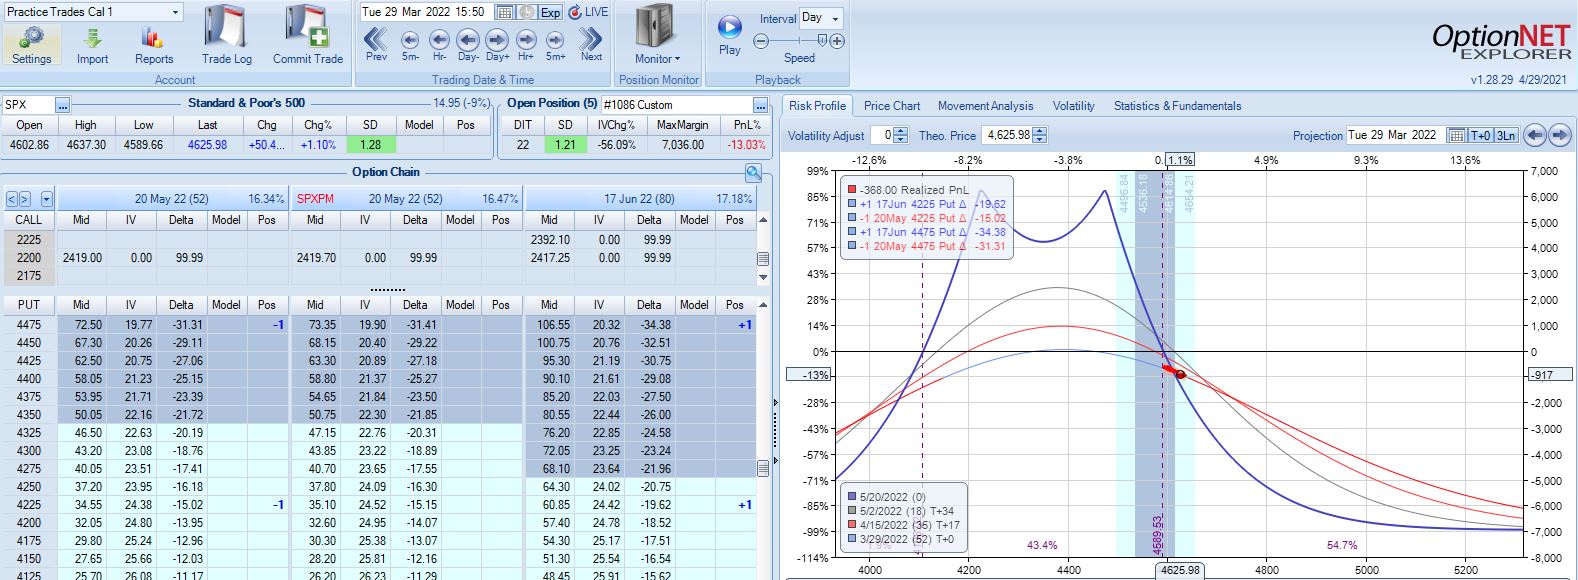
With SPX at 4568, trade #14 begins on 3/28/22 at the 4575 strike for $5,918: TD 25, IV 15.8%, horizontal skew -0.4%, NPV 274, and theta 24.
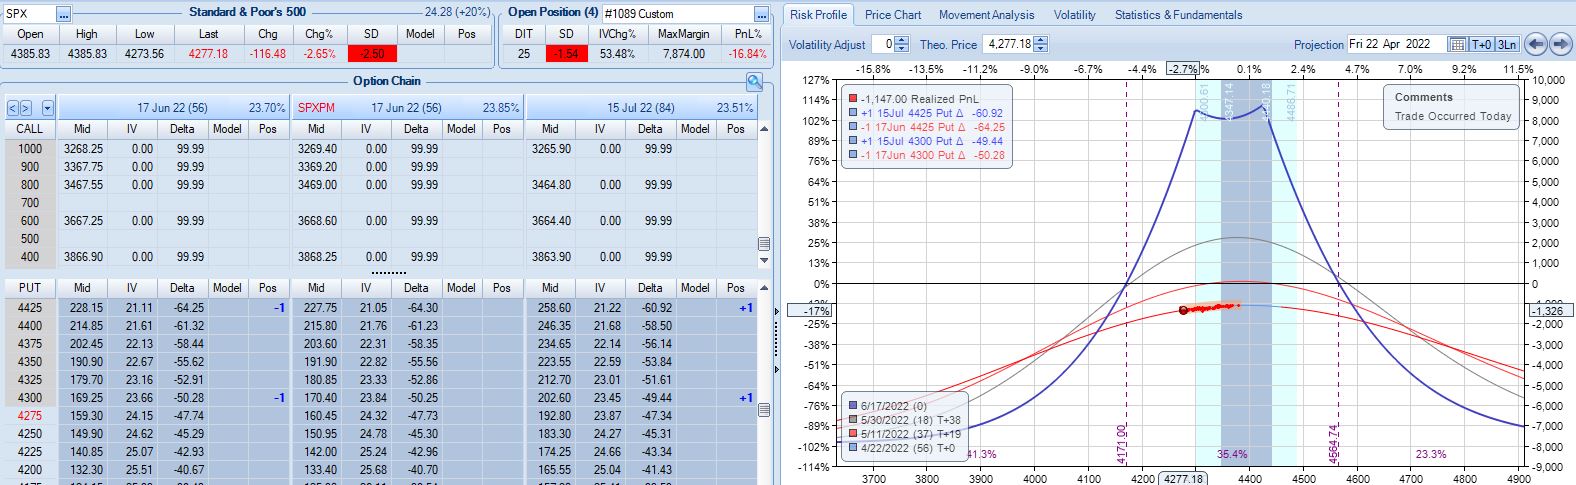
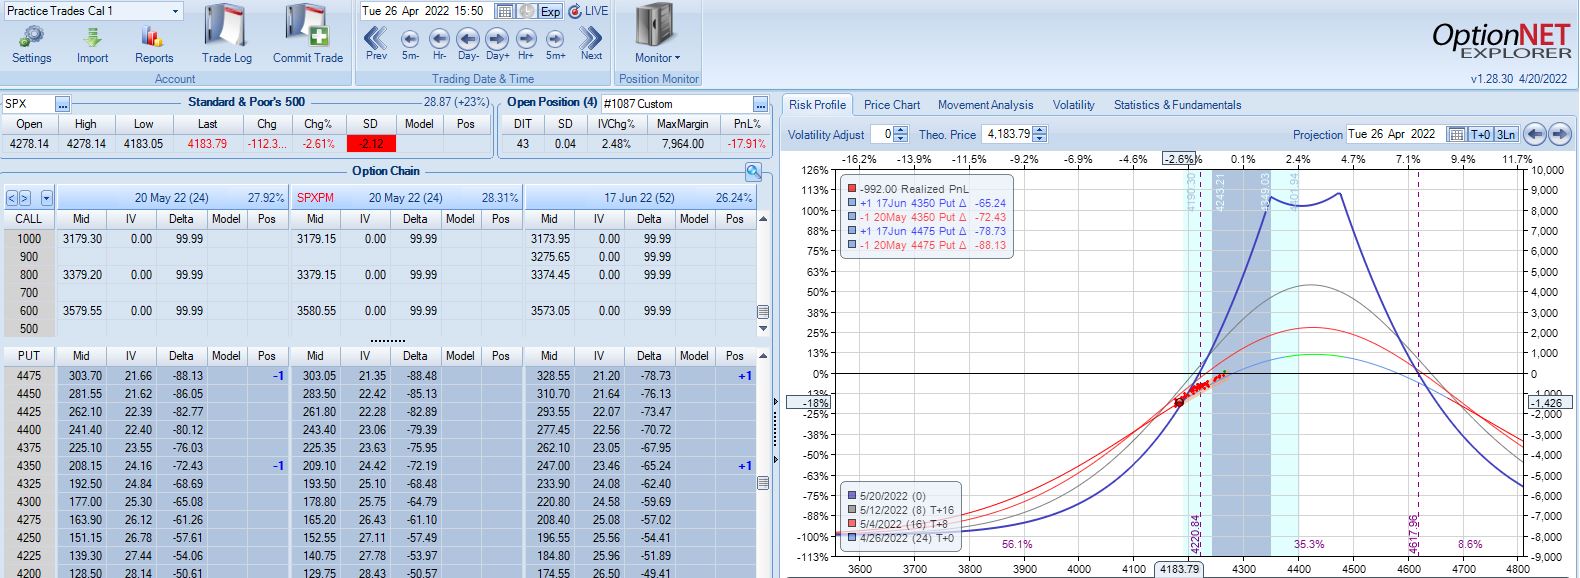
On 67 DTE with SPX down 1.81 SD, the first adjustment point is reached:
On 56 DTE, SPX is down 2.50 SD and the second adjustment point is hit:
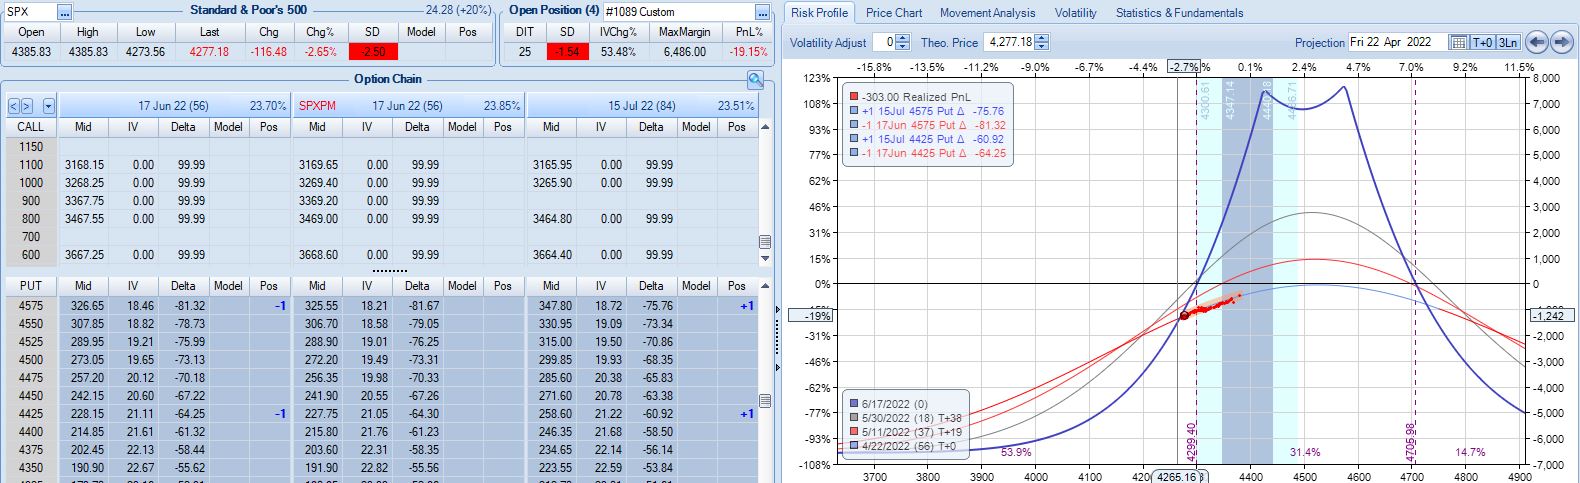
Despite being down no more than 10% before, the trade is now down 19.2% after this huge move. With regard to adjustment, I’m now up against max loss as discussed in the fourth paragraph of Part 6.
I will continue next time.
Categories: Backtesting | Comments (0) | PermalinkTime Spread Backtesting 2022 Q1 (Part 7)
Posted by Mark on August 12, 2022 at 07:14 | Last modified: May 2, 2022 13:49I left off backtesting trade #12 from 3/14/22 with the base strategy shown here.
After the second adjustment, SPX peaks 11 days later at 4626 with position looking like this:
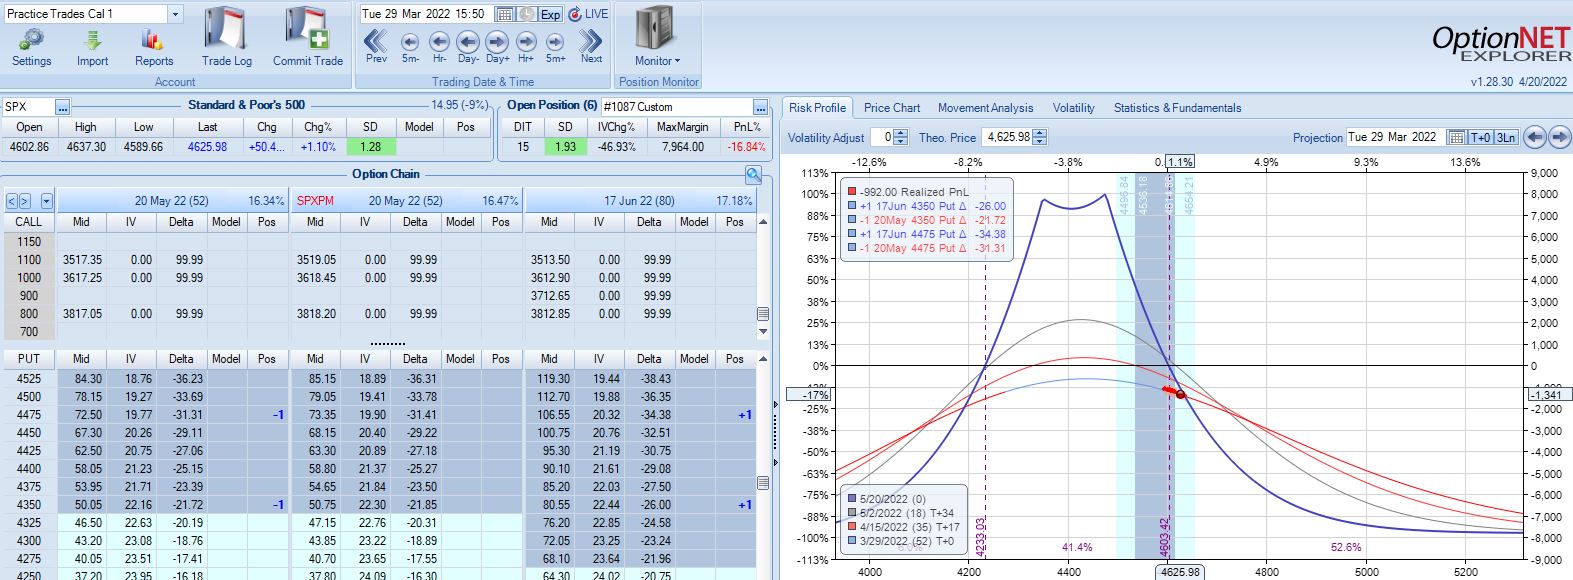
SPX is up 1.93 SD in 15 days and the trade is down 16.9%. The risk graph looks scary, but TD is still 4. Furthermore, having already adjusted twice I have nothing left to do according to the base strategy except wait another day.
On 28 DIT, SPX is in the middle of the expiration tent with trade up 1%.
On 38 DIT, SPX is again near the middle of the expiration tent with trade up 8%.
Three trading days plus a weekend later (24 DTE), the market has collapsed with Avg IV soaring from 19.3% to 28.9%:
This is an adjustment point since the trade had recovered to profitability since the last adjustment.
In live trading, I’d have a tough time adjusting here knowing my exit is three days away. This is a good example of the second deadline discussed in Part 6. I could exit without adjusting and take the big loss, which would still be better than the market going against me [big] again sticking me with an even larger loss.
Anytime I’m staring a big loss in the face, I need to realize it’s just one trade. This is also a big whipsaw (adjusted twice on the way up and then a third time on the way back down). Such whipsaws do not seem to happen often.* Accepting a big loss may be easier when realizing how unusual the situation is to cause it.
Two trading days later at 22 DTE, I find myself in another challenging spot:
Nothing in the base strategy tells me to exit now, but should I consider it given the way this trade has progressed? It’s hard to say without any data. I am fortunate to be down only 5% with one day remaining after being down 15% twice.** If trading systematically based on a large sample size then I should stick with the guidelines. In all my Q1 2022 backtesting, this is the only trade that has been adjusted three times so finding a large sample size of similar cases may prove difficult.
This particular trade has given me lots to consider! I will finish discussing it next time.
*—If I wanted to add a whipsaw-preventing guideline (or test to see how often this occurs), I could plan
to exit at the center or opposite end of the expiration tent after an adjustment is made.
**—The relevant exit criterion to be tested would be something like “if down more than X% at any point,
lower profit target from 10% to Y%.” Another could be “if under 28 DTE, lower profit target to Z%.”
Time Spread Backtesting 2022 Q1 (Part 6)
Posted by Mark on August 4, 2022 at 06:39 | Last modified: May 2, 2022 10:31Before continuing the manual backtesting of 2022 Q1 time spreads by entering a new trade every Monday (or Tuesday), I want to discuss alternatives to avoid scary-looking graphs (see last post) and cumbersome deadlines.
Scary-looking risk graphs can be mitigated by early adjustment. TD = 3 in the lower graph of Part 5. Perhaps I plan to adjust when TD falls to 3 or less. I used this sort of methodology when backtesting time spreads through the COVID-19 crash. Another alternative, as mentioned in Part 3, is to adjust when above (below) the upper (lower) strike price. To keep adjustment frequency reasonable in this case, I should maintain a minimum distance between the two spreads.
In staying with the ROI%-based adjustment approach, something I can do to limit adjustment frequency is to adjust once rather than twice between trade inception and max loss. The base strategy looks to adjust at -7% and again at -14%. I could adjust only once at -10% and subsequently exit at max loss, profit target, or time stop.
I’ve noticed two types of time spread deadlines that can make for uncomfortable judgment calls. The first is proximity to max loss. When at an adjustment point, if a small market move can still force max loss then I question doing the adjustment at all. For example, why adjust down 17% if max loss lurks -3% away? Even -14% can be questionable because if down just under that one day, I can be down -17% the next, which puts me in the same contentious predicament.
A second awkward deadline I may face is the time stop. Base strategy calls for an exit no later than 21 DTE. Adjustments require time to recoup the transaction fees. At what point does adjustment no longer make sense because soon after the trade will be ending anyway? Rather than adjust at, say, 23 DTE, I could close a bit early in favor of a farther-out spread. Such a condition was not included in the base strategy guidelines but may be worth studying.*
Let’s continue with the backtesting.
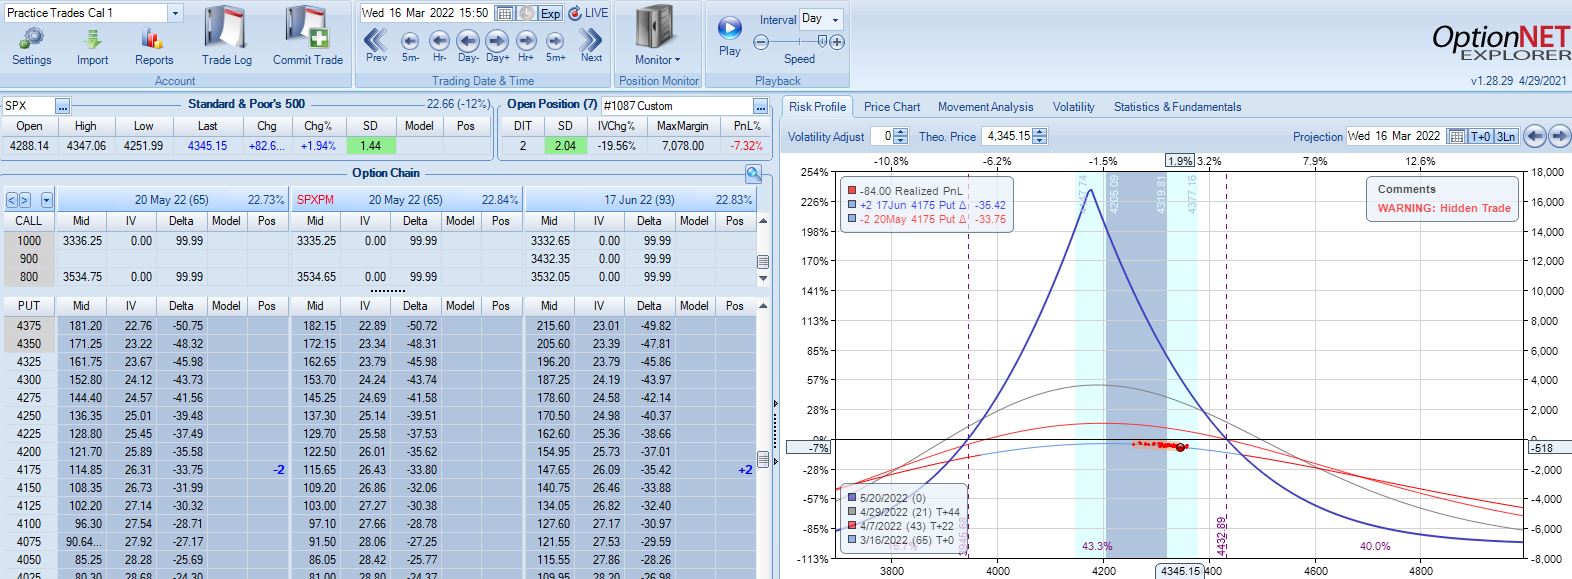
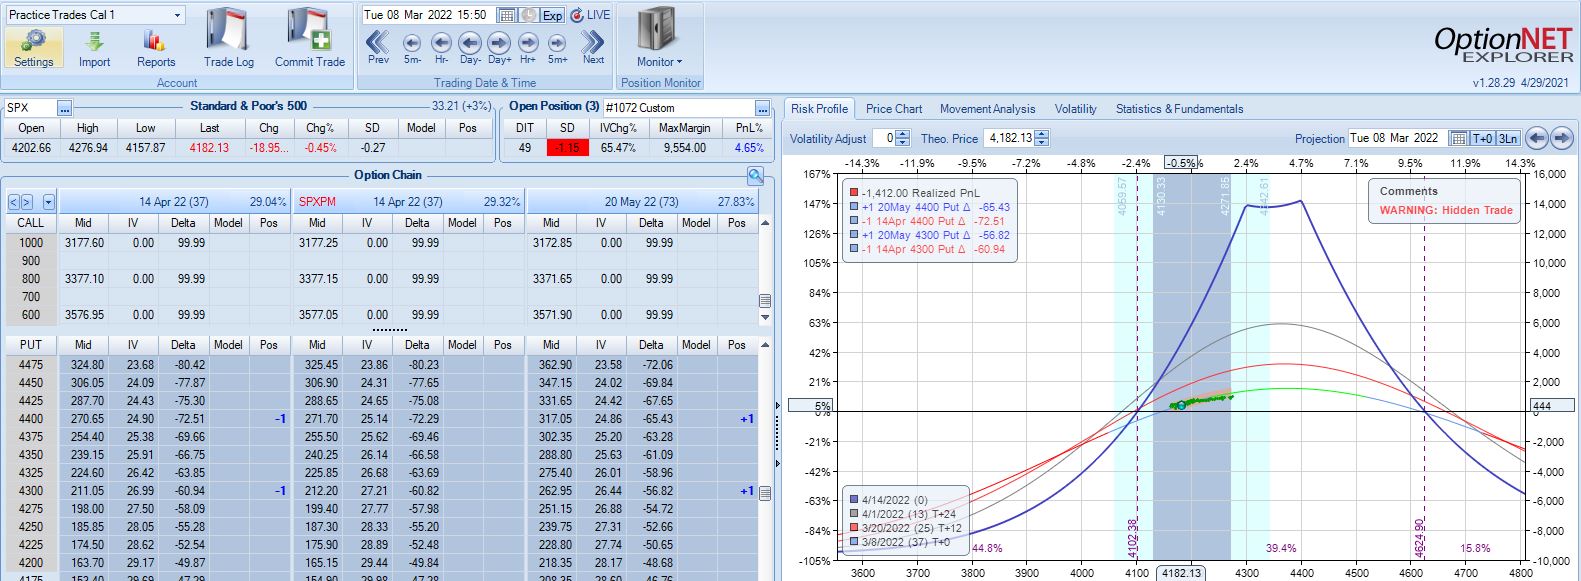
Moving forward through 2022 Q3 with SPX at 4168, trade #12 begins on 3/14/22 at the 4175 strike for $7,078: TD 46, IV 28.2%, horizontal skew 0.3%, NPV 270, and theta 50.
First adjustment point is hit two days later with trade down 7%:
Second adjustment point is hit two days after that. SPX is up 2.38 SD in four days with trade down 16%:
I will continue next time.
*—Aside from varying the drop-dead adjustment DTE, I am also interested to see what happens if
the position is always rolled out at adjustment points whenever the front month is under 60 DTE.
Time Spread Backtesting 2022 Q1 (Part 5)
Posted by Mark on July 5, 2022 at 06:25 | Last modified: April 15, 2022 15:51I’m in the process of manually backtesting time spreads through 2022 Q1 by entering a new trade every Monday (or Tuesday).
I left off describing the controversy of managing time spreads. Simply with regard to adjustment timing, I have mentioned:
- ROI% thresholds
- Repeating ROI% thresholds if PnL “recovers” (and the need to operationally define that word)
- TD
- Drawdown %
- Using the spread strike prices as adjustment thresholds
With SPX at 4474, trade #7 begins on 2/7/22 at the 4475 strike for $8,041: TD 46, IV 20.5%, horizontal skew -0.1%, NPV 367, and theta 47. This trade reaches PT on 24 DIT with one adjustment for a gain of 10.4%. Max DD is -12%.
With SPX at 4403, trade #8 begins on 2/14/22 at the 4425 strike for $5,528: TD 25, IV 23.5%, horizontal skew 0.1%, NPV 246, and theta 27. This trade reaches PT on 29 DIT with one adjustment for a gain of 12.4%. Max DD is -10.3%.
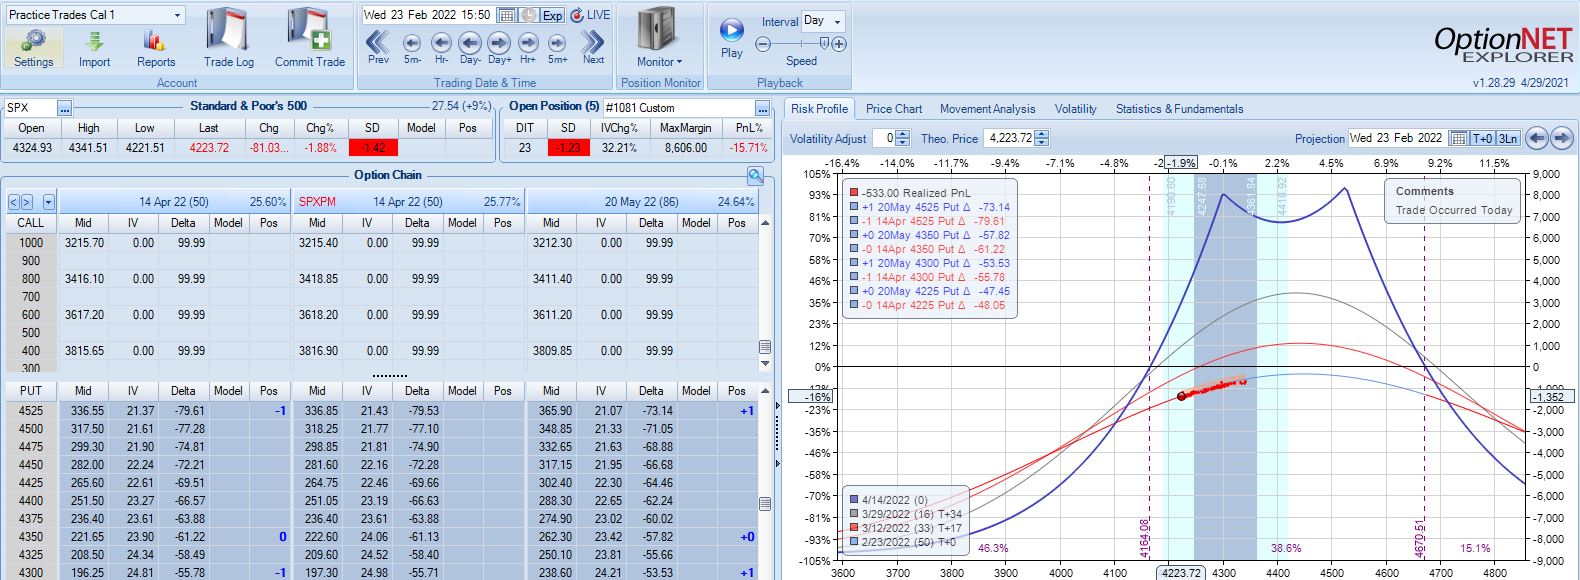
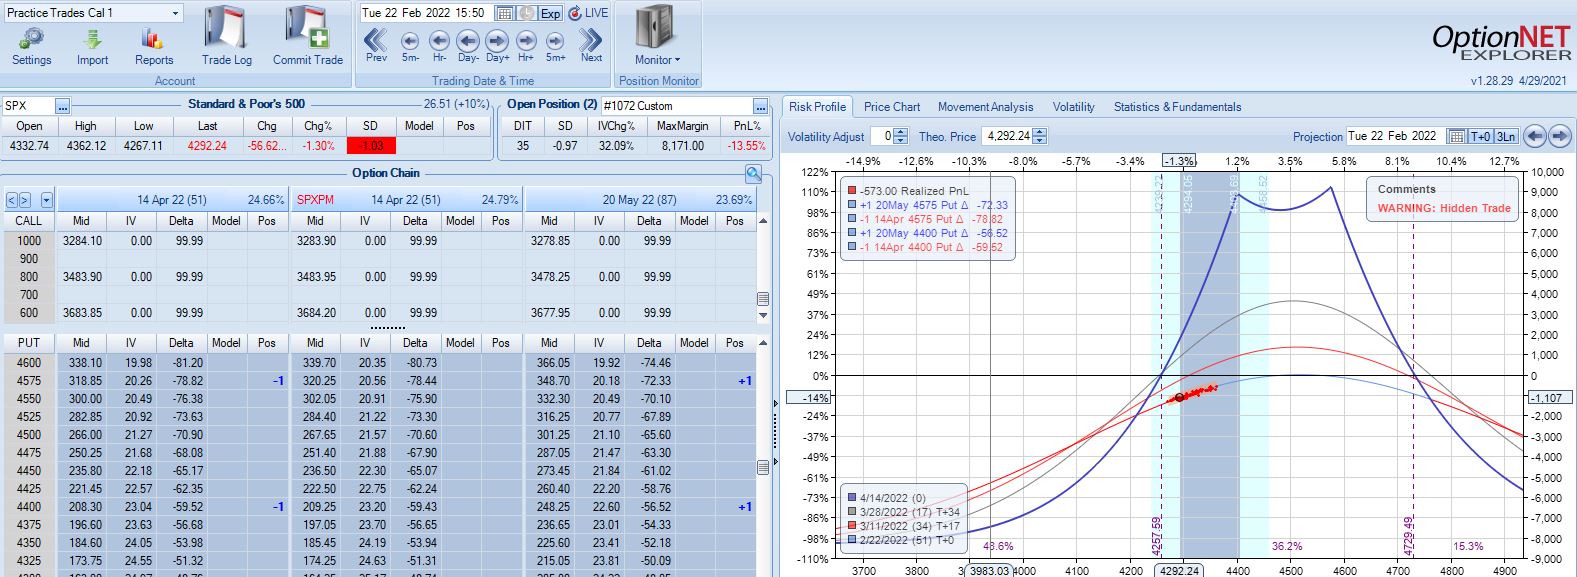
With SPX at 4292, trade #9 begins on 2/22/22 at the 4300 strike for $5,698: TD 37, IV 26.5%, horizontal skew 0.2%, NPV 246, and theta 32. This trade reaches PT on 15 DIT with no adjustments for a gain of 15.0%. Max DD is -3.7%.
With SPX at 4366, trade #10 begins on 2/28/22 at the 4375 strike for $5,998: TD 37, IV 26.1%, horizontal skew 0.2%, NPV 261, and theta 35. This trade reaches PT on 15 DIT with no adjustments for a gain of 10.7%. Max DD is -3.5%.
With SPX at 4201, trade #11 begins on 3/7/22 at the 4225 strike for $6,598: TD 37, IV 34.1%, horizontal skew 0.5%, NPV 262, and theta 48.
With SPX up 1.04 SD over 11 days, the first adjustment point is hit with trade down 9%:
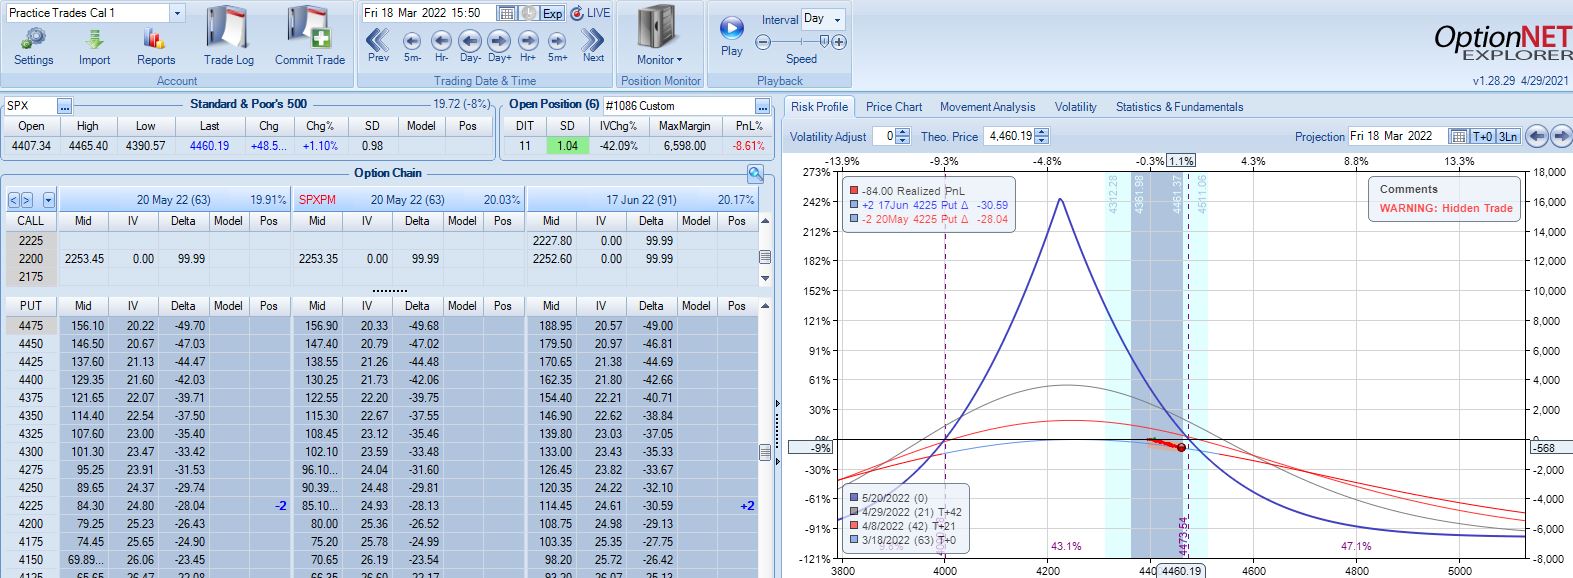
Trade down 13% after 22 DIT, but despite another scary look (see Part 4, first graph) this is not the second adjustment point:
PT is hit two weeks later with a gain of 11.3%. Max DD is the 13% shown above. Unlike trade #6, doing a pre-emptive adjustment this time is followed by max loss two weeks later (-20.1%).
I don’t necessarily think the base strategy is good or better just because trade management matters for trade #11. More than anything else, I feel lucky and I realize that at market pivots, I will feel equally unlucky going through other trades that proceed to lose.
While I await a larger sample size to make any determination about optimal strategy guidelines, I suspect this sort of ambiguity is what is what makes time spreads difficult to trade.
I will continue next time.
Categories: Backtesting | Comments (0) | PermalinkTime Spread Backtesting 2022 Q1 (Part 4)
Posted by Mark on July 1, 2022 at 07:22 | Last modified: April 15, 2022 15:22Today I continue manual backtesting of 2022 Q1 time spreads by entering a new trade every Mon (or Tues in case of holiday).
With SPX at 4403, trade #5 begins on 1/24/22 at the 4425 strike for $7,598: TD 29, IV 25.7%, horizontal skew 0.2%, NPV 334, and theta 43.
Profit target is hit 32 days later with trade up 15.82% and TD 20. Nothing to see here.
With SPX at 4515, trade #6 begins on 1/31/22 at the 4525 strike for $7,578: TD 32, IV 20.8%, horizontal skew -0.1%, NPV 356, and theta 41.
According to the base strategy, this is not an adjustment point with SPX down 0.79 SD over 18 days:
Trade is only down 3% and TD (not mentioned in base strategy guidelines) = 4. Graphically, expiration breakeven looks close such that another substantial SPX move lower could mean big trouble.
This is exactly what happens the very next trading day with a 1.03 SD selloff. The pre-emptive adjustment just mentioned would have the trade down less than 9% and just under 14% the day after: an even worse selloff at 1.42 SD. The trade would then go on to reach PT with a gain of 14.1% after 30 DIT.
Sticking with the base strategy would put me at an adjustment point the next trading day (22 DIT):
Trade is now down 12% after a 1.03 SD selloff in SPX, which is not as bad as I might have expected. What is somewhat frustrating about adjusting for the first time down 12% is the next adjustment point lingering a mere 2% away.
The lesson here may be to mind the numbers (TD 4 is much better than 1-2) rather than a graph that may not be properly scaled for best interpretation. A holiday separates the two graphs above, too; the extra day of time decay can help PnL.
The very next day (23 DIT), that 1.42 SD selloff puts the trade down 16%:
The base strategy does not address days between adjustments, which means I should adjust on back-to-back days as needed. My gut wants to minimize adjustments because of slippage loss,* and skipping this second adjustment gets me to PT with a gain of 13% after 32 DIT. The risk of skipping the second adjustment is that a big move catapults me well beyond -16% to max loss before a second adjustment can be made.
Adhering to trade guidelines and making adjustments on back-to-back days results in a 10% profit after 37 DIT. For this particular trade, the specifics of management really do not matter.
You can get a sense of why I find time spreads so challenging, though. “The devil’s in the details,” and there are lots of details in which to get lost.
I will continue next time.
* — I need to trade more time spreads to get a feel for how significant this is.
Time Spread Backtesting 2022 Q1 (Part 3)
Posted by Mark on June 28, 2022 at 07:21 | Last modified: April 14, 2022 16:29Today I continue backtesting time spreads on 2022 Q1 in ONE with the base strategy methodology described here.
With SPX at 4281, trade #3 begins on 3/9/22 at the 4300 strike for $6,718: TD 35, IV 30.2%, horizontal skew +0.3%, NPV 270, and theta 44.
The first adjustment point is hit at 13 DIT with trade down 7%:
One week later with trade down 9%, is this the second adjustment point?
The first adjustment was down 7% and trade recovered to -2% but never turned profitable. I didn’t specifically define “recover” in the base strategy guidelines, but in case it means “to profitability” then I should hold off until -14% for a second adjustment even though the graph suggests we may be on the slippery slope already. Without data from a large sample size I don’t necessarily think either way is wrong: I just need to be consistent.
Profit target is hit 15 days later with trade up 10.34%. Position is almost completely delta neutral at that point (TD = 358).
Thus far, I have covered three time spreads in 2022 beginning on Jan 4, Jan 18, and Mar 9. Let’s look at the rest assuming I enter a trade every Monday (or Tuesday in case of holiday).
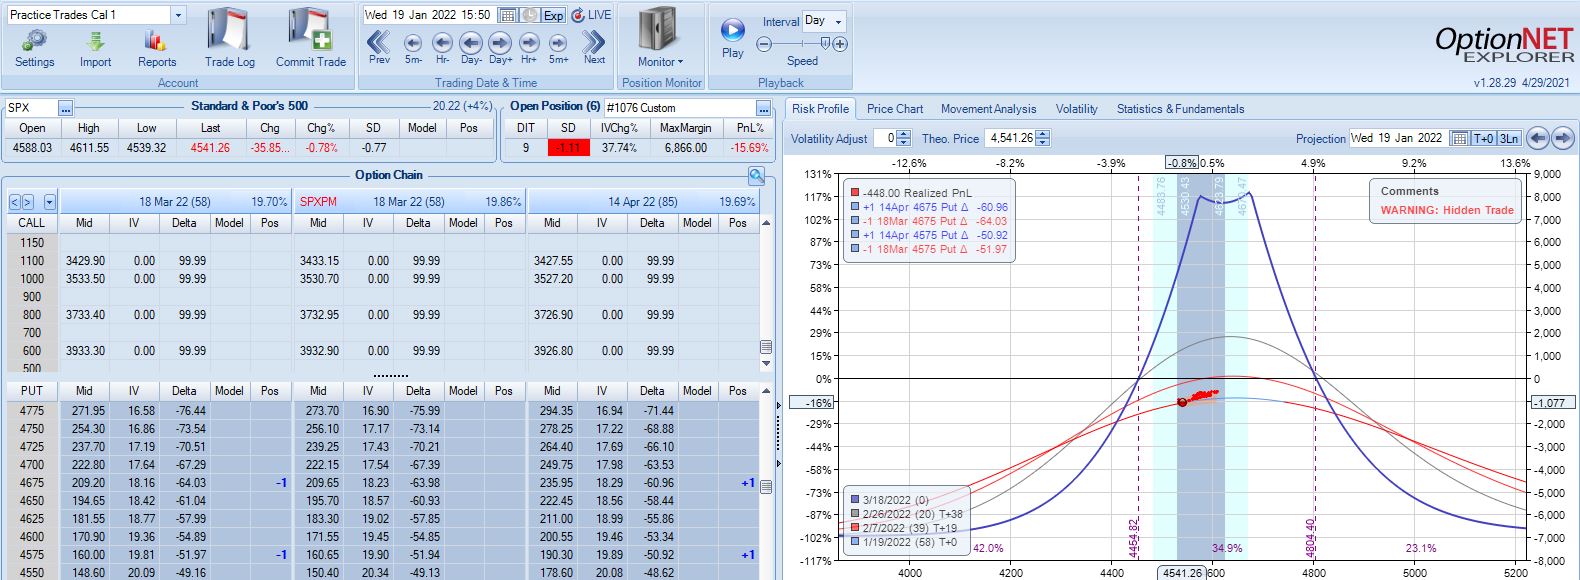
With SPX at 4661, trade #4 begins on 1/10/22 at the 4675 strike for $6,528: TD 17, IV 14.7%, horizontal skew -0.8%, NPV 294, and theta 24.
On 8 DIT, first adjustment point is hit after a 2.44 SD SPX move lower with trade down 11%:
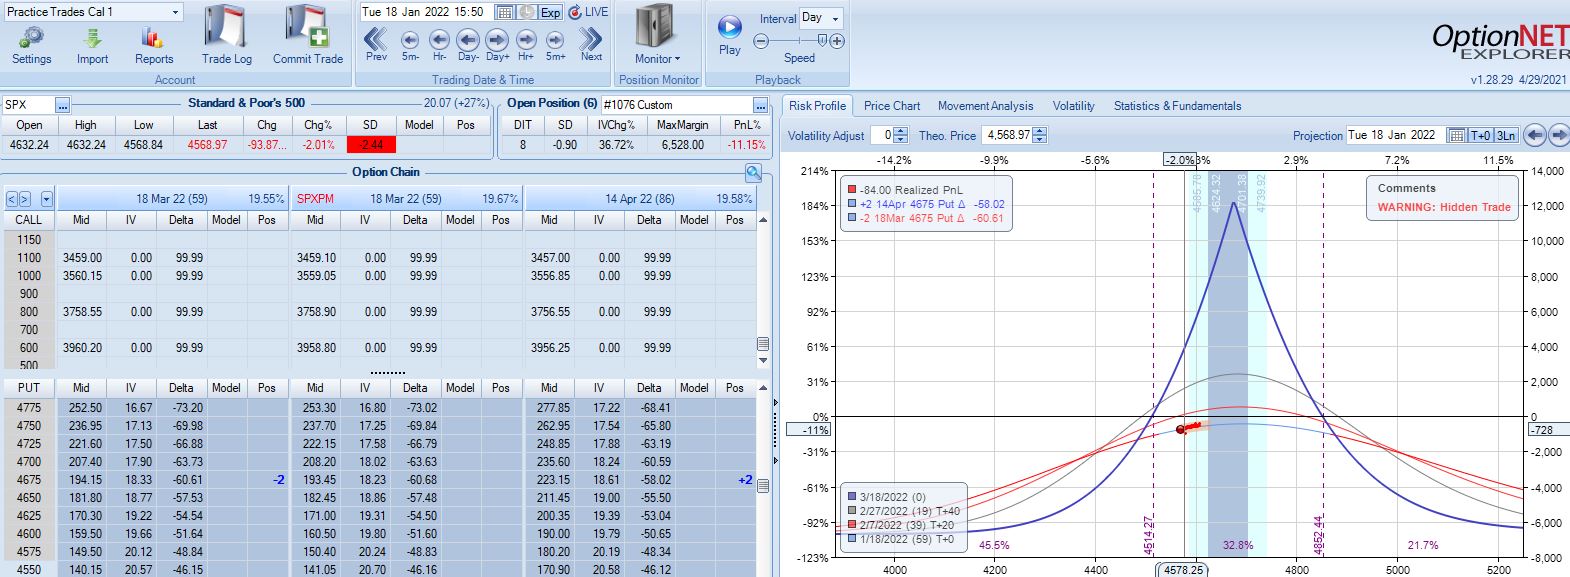
Second adjustment point is hit the very next day with SPX down 36 points and trade down 16%:
This adjustment is tricky with SPX at 4541 and current strikes at 4675/4575. If I roll to the nearest ITM strike at 4550, then I have spreads only 25 points apart. I could roll to an OTM strike that is at least 75 points away if not more. I could also close the 4675 spread and stick with one spread for now, but despite increasing TD, this also reduces theta ~50%, which could require staying in the trade much longer. One benefit of rolling to cut NPD by a target percentage (see fourth paragraph of Part 2) would be to eliminate this judgment call entirely.
Speaking of spreads only 25 points apart, I often see a recommendation to adjust (roll) time spreads when the underlying price moves beyond a strike. If the strike prices are extremely close, then another adjustment is almost a certainty and I would have to ask why bother even rolling into such a structure at all?
For our purposes here, I will roll to 4500 to leave at least 75 points between time spreads. That feels comfortable to me, but I have no data to support or oppose it.
Max loss is hit two days later on a 1.58 SD SPX move lower with trade down 20.1%. Staying with a market move of -2.2 SD over 11 days is going to be difficult no matter what the guidelines.
I will continue next time.
Categories: Backtesting | Comments (0) | PermalinkTime Spread Backtesting 2022 Q1 (Part 2)
Posted by Mark on June 23, 2022 at 06:52 | Last modified: April 11, 2022 14:23I just got done watching King Richard. Like Venus Williams in the movie, we can’t win them all. We don’t have to win them all, though, to have tremendous success. I think we’ll find this to be true with regard to Q1 2022 time spreads.
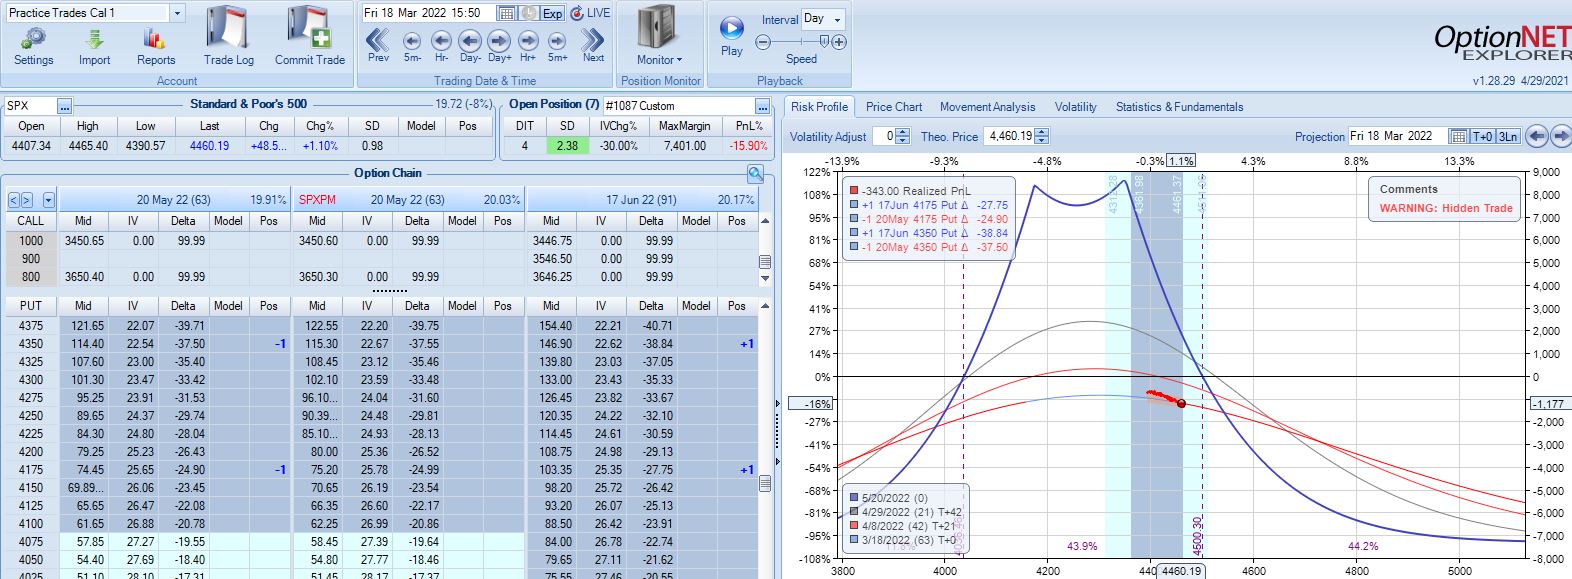
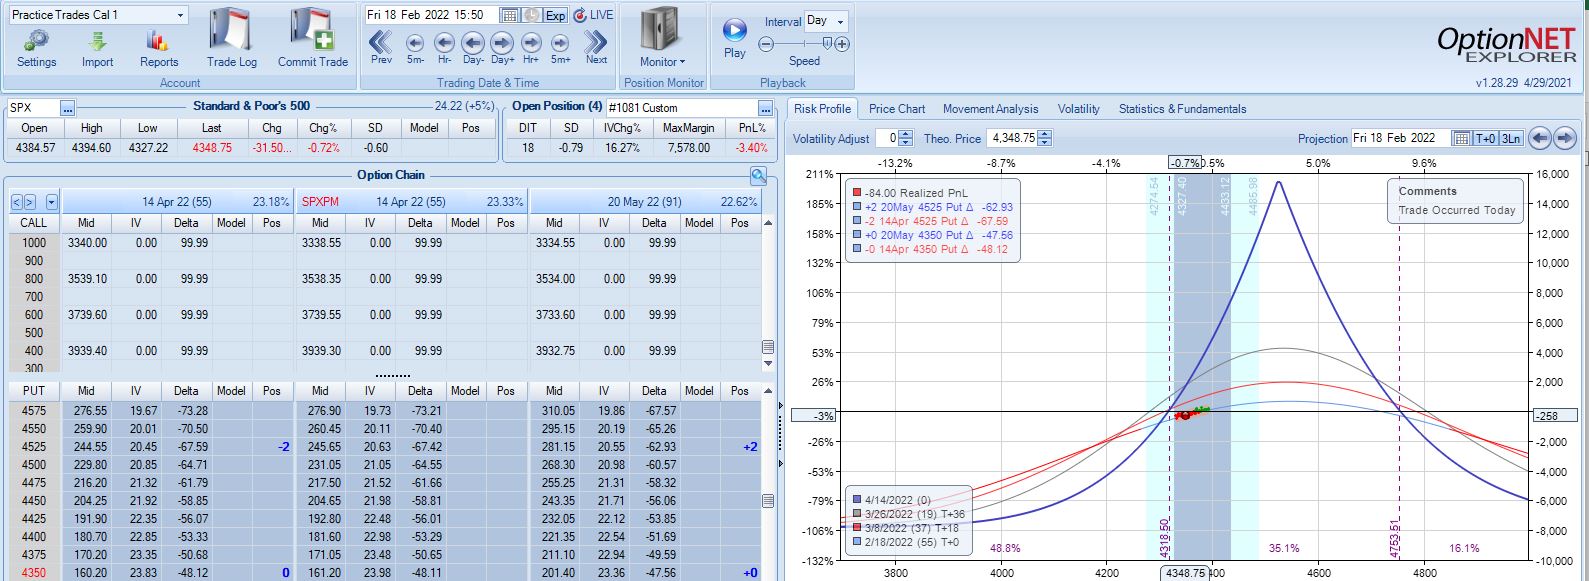
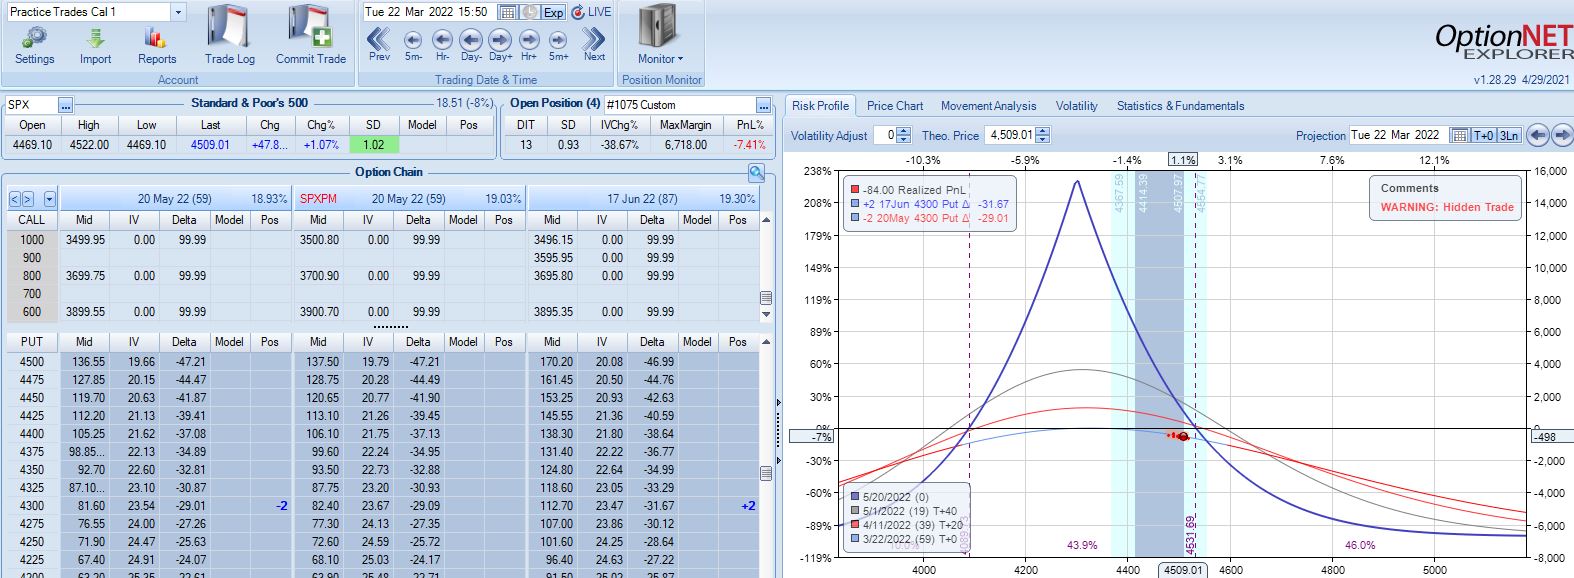
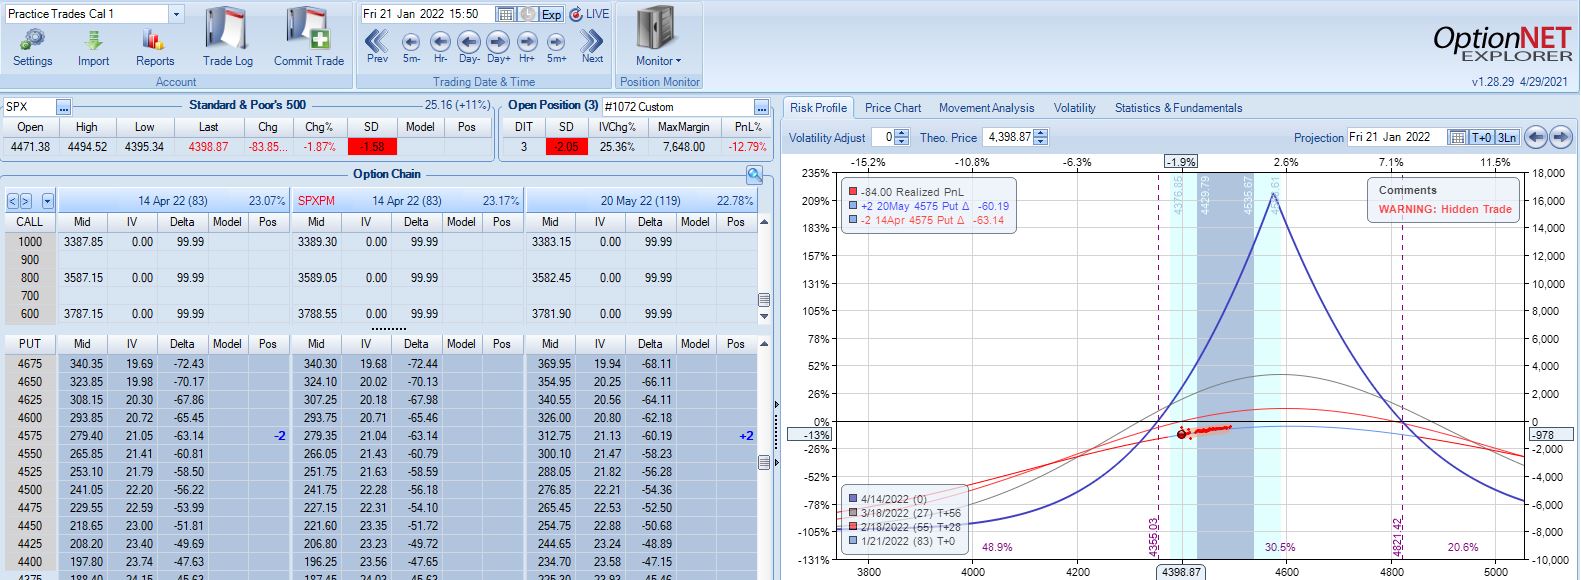
With SPX at 4569, trade #2 begins on 1/18/22 at the 4575 strike for $7,648: TD 27, IV 20.1%, horizontal skew -0.4%, NPV 336, and theta 30.
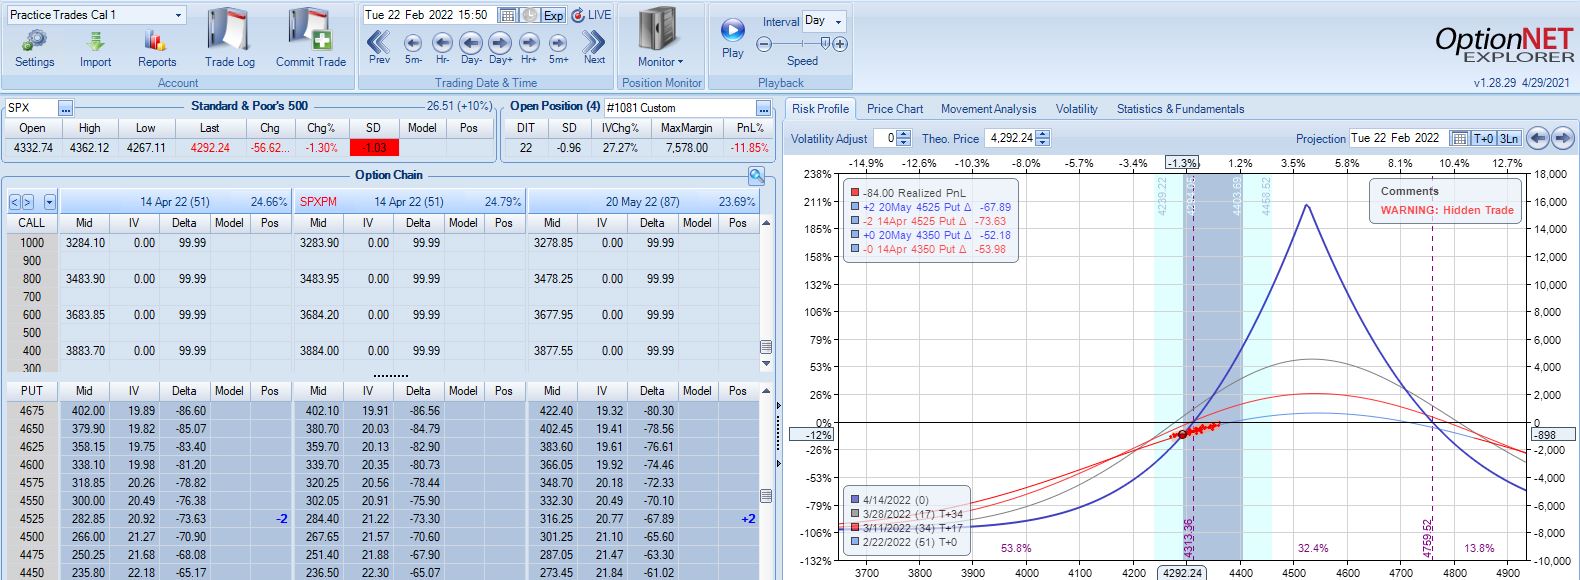
Three trading days later, a 1.58 SD move lower gets us to the first adjustment point down 13%:
Adjustment may be done a couple different ways. Creating the new strike ATM will maximize theta but cut NPD less. Alternatively, I can aim to cut NPD by a target amount (e.g. 50-75%). Placing the new strike farther OTM in this way will boost TD at the cost of a lower position theta, which means more time in the trade in order to hit PT. Whether either is better depends on statistical analysis of a large sample size. That’s precisely why I seek the Python backtester.
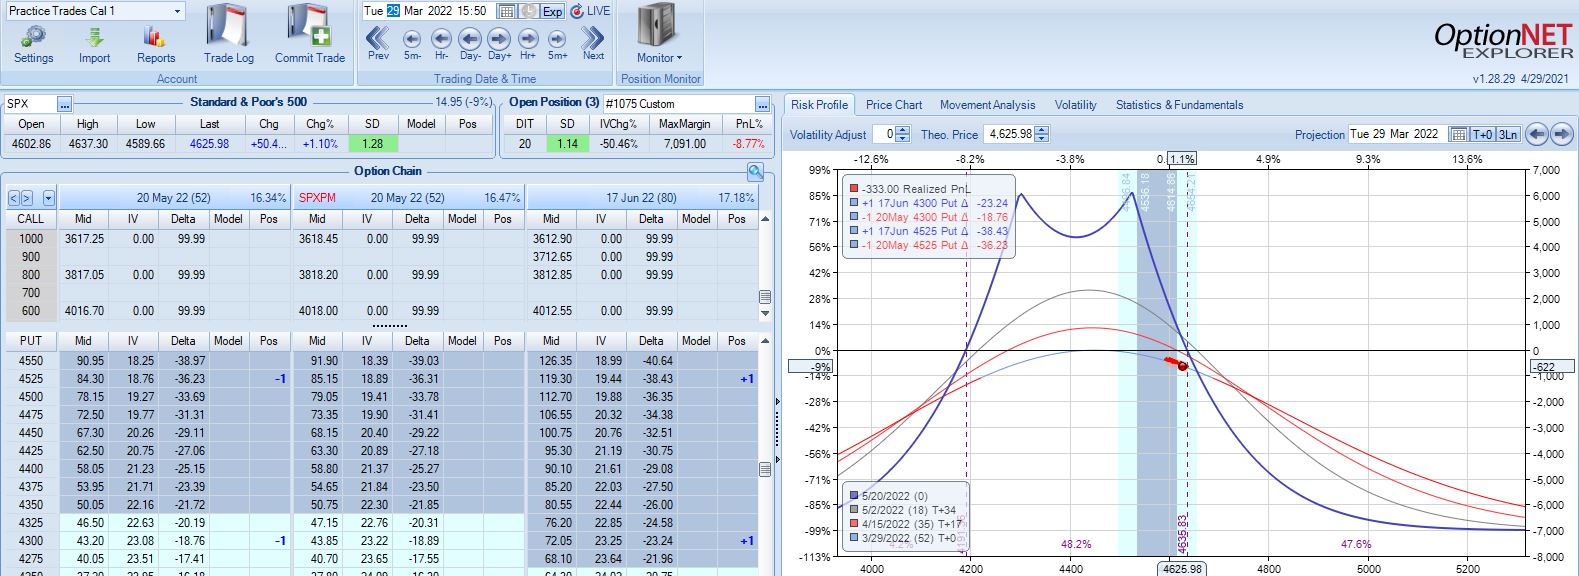
This adjustment lasts just over one month until the second adjustment point is reached down 14%:
Moving ahead two weeks, is this the third adjustment point?
Unlike the second adjustment, trade is now up 4.6% with TD = 8.
I generally feel it more important to adjust when down money especially if moving onto the “slippery slope” portion of the T+0 curve. Such is not the case here. Another approach would be to trigger off trade drawdown rather than net PnL%. That is, if trade is up 8% and then falls to +1%, consider adjustment since it now registers a 7% drawdown from +8%. Again, whether any of these are better depends on statistical analysis of a large sample size, which is why I seek the Python backtester.
This particular trade is a winner either way. Without adjusting, PT is hit the very next day (49 DIT). With adjustment, PT is hit six days later. Adjustment costs me five days, but even at 55 days, a 10% profit is over 60% p.a.
I will continue next time.
Categories: Backtesting | Comments (0) | Permalink