Time Spread Backtesting 2022 Q1 (Part 9)
Posted by Mark on September 1, 2022 at 06:49 | Last modified: May 18, 2022 17:16Today I will conclude my time spread backtesting for 2022 Q1.
I left off at the second adjustment point of trade #14. Pre-adjustment, this is very close to max loss.
Whether the mere act of adjusting makes ROI% better or worse is simply a matter of arithmetic. The first adjustment worsens ROI% from -7.4% to -8.1%. The second adjustment improves ROI%. MR increases by $1,388, which is a bigger change than that resulting from the first adjustment (+$568). PnL pre-second-adjustment is -19% vs. -7.4% for the first, though. To maintain ROI%, the larger MR would have to be accompanied by a loss that is $263 higher. Transaction costs are fixed at $21/contract, which is $84/adjustment. Because $84 < $263, the second adjustment dilutes ROI% back to -16.8%:
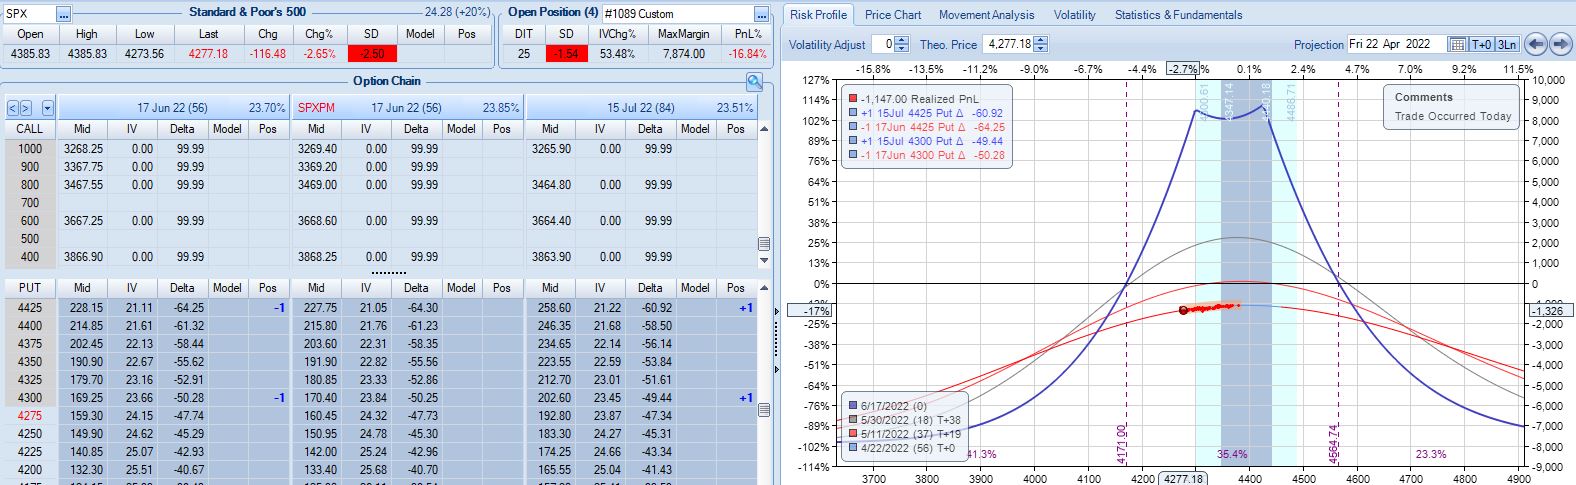
At this point, TD = 11. According to ONE, I only have ~1% of downside before -20% max loss is reached.* Is the adjustment worth doing? Certainly in the absence of a guideline preventing it (see base strategy in Part 1), I have to say yes.
Max loss is hit at -21.4% four days later on a 2.12 SD market decline. For the trade, SPX falls 1.88 SD over 29 days although it’s only down 1.34 SD over 28. Unpredictability of large moves is one reason this endeavor can be so difficult.
In total for 13 trades entered in Q1,** the base time spread strategy makes $1,855 on a max margin of $10,252. The latter also represents the greatest increase from initial capital (+45%) seen in 158 historical trades. Although it’s probably far more than I need, I like to err on the side of conservatism. Doubling the $10,252 will provide for a substantial margin of safety.
The time spread return is therefore +9.0% for Q1 2022 compared to -12.8% for SPX. That is a shellacking with which I would be quite satisfied (compare here). The overall PF is low (but profitable!) at 1.28. The average win (loss) is $938 (-$1,647) on 9 (4) total wins (losses). Over just 13 trades, the max consecutive number of wins vs. losses is two vs. eight, respectively: pretty healthy [for equity curve to hang out near all-time highs most of the time]. Those two started out the year, though, which made for what would ultimately be the max drawdown (MDD) of -15.7%.
Rounding up to four total months of backtesting, the annualized time spread return is +27%. As always, don’t count on any good result repeating every year.
Taking a normalization approach, MR for each trade can be divided into any fixed number you choose to get position size. The PnL numbers then turn out slightly different. Normalizing for $100K, I get a Net PnL of $21,541 (+21.5%) and a PF of 1.21, which is slightly worse than without normalizing (heed the less-impressive result). MDD after the first two trades is about -49%. That’s way too high for my risk tolerance. MDD would be -19.6% if normalized for $250K MR. I find this more reasonable. At this level, total return falls to +8.6%, which is +25.8% annualized.
* — The automated backtester would not have access to this information.
** — 14 includes trade #3 starting 3/9/22 and trade #11 starting 3/7/22. I took the worst
of the two since both occurred in the same week.