Investing in T-bills (Part 19)
Posted by Mark on March 28, 2024 at 11:04 | Last modified: April 11, 2024 12:04I’ve covered a lot of quality detail in this mini-series involving T-bill investing, option trading, municipal bonds, and margin requirements. I will finish today tying up a few other loose ends.
Despite the title “Investing in T-bills,” some may actually consider it trading. As discussed in the fourth paragraph of Part 12, my bond-ladder structure requires a T-bill purchase every week. This may be deemed frequent for those who associate “investing” with long-term buy-and-hold (i.e. few required and/or infrequent transactions). I consider it investing in terms of maintaining an interest-generating vehicle over a longer-term period, but it does require a minimal time commitment.
Prior to the Part 8 revelation that overall option decay of synthetic long stock (SLS) substantially weakens its candidacy as a proxy for long shares, I had two other thoughts about taking advantage.
First, using only long calls instead of [together with short puts to form] SLS would limit the unlimited [to zero] downside risk. Something similar can be accomplished by purchasing roughly half the number of shares and using remaining free cash to invest in T-bills. The capital requirement of half the shares would still be greater than either long calls or SLS, but shares are not subject to the additional payment for time premium.*
Despite the weakened candidacy mentioned above, long calls carry a different risk profile than [SLS or] long stock; backtesting could be used to determine what strategy might be superior.
Second, SPX SLS may be a good proxy for any large-cap ETF or mutual fund. Edge realized by large-cap ETFs or mutual funds that beat the S&P 500 [in some years, at least] would be more than offset by the additional 5.0% return on capital saved by trading SLS instead of long shares.
The Dimensional US Large Company Portfolio (DFUSX) is one such example that does not bear out as advertised. A couple years ago, I spoke with an investment adviser (IA) who uses Dimensional Funds for clients. By retaining most benchmark components while excluding just a few, he said, Dimensional funds outperform. On 4/11/24, I looked at DFUSX holdings (as of 2/29/24) to find 504 stock holdings. The most-recent S&P 500 update I can find (Investopedia from 9/26/23) reports 500 companies have issued 503 total stocks. At 504, DFUSX has added and either not excluded or substituted thereby contradicting the IA. DFUSX also has a somewhat-perplexing 505th position: S&P 500 futures. With stock futures usually in contango, this represents a slight drag over time.
SLS no longer seems like a good proxy for DFUSX given the weakened candidacy mentioned five paragraphs above.
In summary, I would avoid SLS as a proxy for long shares to be used for non-option traders [paying an option-trading IA to manage]. While I think T-bills [or something comparable] are a necessary component to supplement an option portfolio, SLS may be a poor proxy even for option traders given the additional expenses related to taxes and transaction fees.**
* — Suggesting that even before the Part 8 discovery, I knew about the time premium expense—
just not how much more time premium is lost by the long call than gained by the short put.
** — As mentioned in this second paragraph, I need to expand the sample to verify the ~0.5%
SLS edge.
Investing in T-bills (Part 18)
Posted by Mark on March 25, 2024 at 16:11 | Last modified: April 11, 2024 09:07As mentioned in the last full paragraph of Part 4, selling puts facilitates T-bill investment by raising cash balance. Short puts are proportional to overall risk, however, and such transactions are subject to specific maintenance margin requirements (MR).
[Initial MR is equal to] Maintenance MR for short puts [and] is calculated differently than that discussed for equities in Part 16. MR is the greatest of:
- Current market value of option(s) + 20% of underlying stock – amount out of the money (OTM; otherwise zero) [1]
- 10% of exercise value of underlying stock + premium value [2]
- Premium value + $50/contract [3]
Example #1: sell six short puts on ABC (stock) at $80 strike price for $2.50 each with ABC at $81.25/share
[1] ($2.50 x (6 x 100)) + [(20% / 100) x ($81.25 x (6 x 100))] – (($81.25 – $80.00) x 600) =
$1,500 + $9,750 – $750 = $10,500
[2] [(10% / 100) x ($80 x (6 x 100))] + ($2.50 x 600) = $4,800 + $1,500 = $6,300
[3] ($2.50 x 600) + ($50 x 6) = $1,500 + $300 = $1,800
$10,500 is greatest (the 20% MR [1]).
Example #2: sell six short puts on XYZ (stock) at $70 strike price for $0.75 each with XYZ at $81.25/share
[1] ($0.75 x (6 x 100)) + [(20% / 100) x ($81.25 x (6 x 100))] – (($81.25 – $70.00) x 600) =
$450 + $9,750 – $6,750 = $3,450
[2] [(10% / 100) x ($70 x (6 x 100))] + ($0.75 x 600) = $4,200 + $450 = $4,650
[3] ($0.75 x 600) + ($50 x 6) = $450 + $300 = $750
$4,650 is greatest (the 10% MR [2]). This is just Example #1 with a lower strike price (hence lower premium) selected.
MR is proportional to number of contracts because the latter gets multiplied by every term in each calculation. In Example #2, MR is therefore $4,650 / 6 contracts = $775/contract. For 12 puts, MR would be: 12 x $775/contract = $9,300.*
A maintenance call (see fifth bullet point) will be issued when:
MR > market value of securities + free cash – debit balance [4]
- Market value of long (short) securities is positive (negative).
- Market value of OTM short options increases to zero at expiration.
- Debit balance is the loan amount when borrowing funds from the brokerage.*
- Customers typically have two business days to satisfy a maintenance call by falsifying [4] else the brokerage will close positions at its discretion (potential worst-case scenario as catastrophic loss may be locked in).
While short puts increase cash balance, hopefully it’s now clear they are subject to MR limitations regarding max quantity with direct implications for risk.
Initial MR for long options is 100% of the purchase price. Cash balance decreases upon purchase and no maintenance MR subsequently applies.
As a reminder, synthetic long stock (SLS) is a combination of long call(s) and short put(s) at the same strike [price].
That light at the tunnel is getting quite bright!
*–MR is not to be confused with margin loan (“debit balance” in [4]) that occurs when cash balance goes negative.
Investing in T-bills (Part 11)
Posted by Mark on March 6, 2024 at 10:32 | Last modified: April 3, 2024 09:51The original plan was to finish discussing considerations about synthetic long stock (SLS) + T-bills versus long shares and then crown a winner. Due to the Part 8 revelation that advantage of the former is < 0.5% (further discounted by fees as discussed last time), I now regard other considerations to be moot. I will continue going through them for educational purposes only.
In the spirit of completeness, the <0.5% calculation should be replicated. I did this using data for the 5275 strike with the underlying around 5235. For a better sampling, I would like to look at strikes 50 – 200 points above and below the market by increments of 50. New data should be used because more than 10 days have passed and SPX no longer trades at the same level. This exercise is important to ultimately crown a winner.
I discussed liquidity of SPY options last time but also expressed assignment concerns in this third paragraph—a concern minimized by trading SPX options (see that second-to-last paragraph).
With regard to taxes,* two issues become comingled: SPY versus SPX options and holding period.
Pertaining to holding period, realize SLS includes a long call and short put that are each taxed differently. This Schwab article says capital gains** on the former will be long-term (short-term) when held for over (equal to or less than) one year. Income from the short put will be short-term (“ordinary income” tax rates, which are higher than long-term capital gains rates). The combined SLS will be taxed less for a long-term holding period (albeit implying longer-term options that face more slippage as mentioned in the fourth paragraph of Part 10).
Next, realize that SPX options (Section 1256 contracts) get special treatment regardless of holding period: a blended 60% long-term / 40% short-term capital gains tax rate. The SPX short put will benefit when profitable from the blended tax rate. A profitable SPX long call will benefit when held for less than one year (else the blended tax rate may actually be higher).
Even with SPX options taxed less than SPY options, both will be taxed more than buy-and-hold (i.e. holding period over one year) SPY shares. The latter will be taxed at long-term capital gains rates and only when sold. The blended 60% / 40% rate for SPX options is higher and will be assessed every year (mark-to-market accounting for Section 1256 contracts). Thinking about the RMD disadvantage of a traditional IRA compared to a Roth IRA (see Forbes article here) makes me realize the tax efficiency of waiting until sale to be taxed on the whole enchilada rather than being taxed continually on component parts.
As a general statement, I believe taxes make a meaningful difference based on the number of articles I read about them (e.g. on tax cost ratio, on tax-loss harvesting, on long-term capital gains rates vs. ordinary income, on qualified dividends, etc.).
While difficult to quantify (especially until one decides how SLS holding period and DTE at inception will be managed), I’m giving the tax advantage to long shares. Along with fees, this further erodes the sub-0.5% SLS edge mentioned above.
I will continue next time.
* — I hereby share my personal experience with issues of taxation. Your circumstances
may differ and loopholes or mitigating details may exist unbeknownst to me. Please
consult a tax advisor for the definitive word on these matters.
** — Also capital losses
Investing in T-bills (Part 10)
Posted by Mark on March 5, 2024 at 14:26 | Last modified: April 2, 2024 07:56I think the realization discovered in Part 8 will prove to be the climax of this blog mini-series. Today I am going to briefly discuss liquidity and transaction fees.
Pertaining to slippage, option liquidity would be important when looking to sell shares and trade the synthetic long stock (SLS) in addition to T-bills. I now know the potential benefit is < 0.5% per year (from Part 8), which may make doing so prohibitive. Regardless, I will proceed with the analysis.
SPY has the most liquid option market and it’s not even close. In the third-to-last paragraph of Part 5, I mention IVV and VOO as examples of S&P 500 ETFs along with SPY. At the next monthly expiration (Apr), IVV has mostly 5-point strikes, double-digit open interest at most call strikes (single-digit for most put strikes), and near-the-money (NTM) bid/ask spreads of 10-15% or more: I wouldn’t touch this with a 10-foot pole. Also for Apr, VOO has 5-point strikes, many triple-digit open interest along with some 4-digit numbers for calls and puts, and NTM bid/ask spreads close to 10%: not good. SPY has 1-point strikes for Apr, open interest of 4-5 (with the occasional 6) digits across most call/put strikes, and NTM bid/ask spreads < 1%.
Slippage is the largest of the option transaction fees—a disadvantage of trading the SLS mentioned in Part 6. Slippage will have to be paid every time SLS is rolled. This is smaller for nearer-term options (see “Total Bid/Ask Spread” column of last Table in Part 7), but nearer-term options will have to be rolled more frequently.
Other fees include:
- The CBOE “proprietary exchange fee” for products traded only on its exchange (e.g. SPX options*).
- Regulatory fees that change periodically but will be passed through to the customer by most brokerages.
- Commission rates that vary by brokerage.
Tasty Trade gives a great example of how these fees add up (reprinted here in case the page should be removed):
> SPX TRADE EXAMPLE
>
> 2 short 3000-strike Call: $30.50 credits
> 2 long 3020-strike Call: $21.50 debit
> Total Credit Received: $9.00 per spread
>
> Cost to Open
>
> Sell to Open: -2 short 3000-strike calls
>
> Commission: $2 ($1/contract)
> Clearing: $0.20 ($0.10/contract)
> Options Regulatory Fee: $0.0581 ($0.02905/contract)
> SEC Fee: $0.1769 ($0.0000229 x 2 x 100 x $30.50)
> Proprietary Index Fee: $1.30 ($0.65/contract)
> Total: $3.7132
>
> Buy to Open: +2 long 3020-strike call
>
> Commission: $2
> Clearing $0.20
> Options Regulatory Fee: $0.0581
> Proprietary Index Fee: $1.30
> Total: $3.5583
>
> The total cost to OPEN the spread: $7.2715
>
>
> Cost to Close
>
> Three weeks later, position is closed for a $3.00 debit, resulting in a $6.00 profit per spread.
>
> 2 short 3000-strike Call: $6.00 debit
> 2 long 3020-strike Call: $3.00 credit
> Total Debit: $3.00 per spread ($600 total debit paid to close)
>
> Buy to Close: -2 short 3000-strike calls
>
> Commission: $0
> Clearing: $0.20 ($0.10/contract)
> Options Regulatory Fee: $0.0581 ( $0.02905/contract )
> Proprietary Index Fee: $1.30 ($0.65/contract)
> Total: $1.5583
>
> Sell to Close: +2 long 3020-strike call
>
> Commission: $0
> Clearing $0.20
> Options Regulatory Fee: $0.0581
> SEC Fee: $0.0174 ($0.0000229 x 2 x 100 x $3.00)
> Proprietary Index Fee: $1.30
> Total: $1.5537
>
> The total cost to CLOSE the spread: $3.112 ($0 commission + $3.10 fees)**
Option transaction fees will further erode the < 0.5% per year edge for trading SLS. With long-term buy-and-hold share positions, minimal fees may only be incurred when opening and closing while equity commissions are often zero these days (consult your brokerage).
I will continue next time with a brief mention of taxes.
* — Whether to trade SPY (third paragraph) vs. SPX options is an entirely separate debate.
SPX is a very liquid market especially for institutional traders.
** — Fees for this trade amount to ($10.384 * 100%) / [($20 * 100 * 2) – ($900 * 2)] =
0.47% of total capital allocation.
Investing in T-bills (Part 9)
Posted by Mark on March 4, 2024 at 10:59 | Last modified: April 1, 2024 10:04The revelation from Part 8 is the hidden cost associated with synthetic long stock (SLS).
To explain this, I now think in terms of an argument that posits edge being arbitraged away once discovered by the masses. T-bills pay annualized interest ~5%: much higher than the default return on cash (currently 0.35% as stated in this second paragraph). This would drive the masses to sell stock, buy calls (or SLS), and invest the capital difference in T-bills. The resultant buying (selling) pressure on calls (puts) would put upward (downward) pressure on call (put) option prices. As seen here, calls end up more expensive than puts.
Nasdaq.com explains this in terms of stock investors who buy on margin:
> When interest rates rise, the cost of borrowing money to buy
> stock on margin increases. For example, if you want to buy
> $10,000 worth of stock on margin, the cost to use margin
> is much higher when interest rates are at 5% vs. 2%.
>
> Therefore, a trader may look to buy a call option to avoid this
> increased margin interest. For this reason, the pricing of call
> options will rise when interest rates are hiked…
>
> The options market reacts to interest rates, causing call options
> to increase in value. Instead of buying $10,000 worth of stock
> on margin, a trader can purchase a call option to benefit from
> the same upside with much less capital, say $1,500.
>
> The saved $8,500 can be put into a risk-free asset such as a
> T-bill to generate interest, allowing the trader to benefit from
> the potential upside of a stock and generate income with a bond.
>
> Due to the traders’ ability to generate a risk-free return on this
> saved capital, the price of call options increases. There is no
> free lunch in the stock market, so when opportunities like this
> arise, it will reflect in the price of call options.
Investopedia explains the decreased put premiums as follows:
> Theoretically, shorting a stock with an aim to benefit from a price
> decline will bring in cash to the short seller. Buying a put has a
> similar benefit from price declines, but comes at a cost as the put
> option premium is to be paid. This case has two different
> scenarios: cash received by shorting a stock can earn interest
> for the trader, while cash spent in buying puts is interest
> payable (assuming the trader is borrowing money to buy puts).
>
> With an increase in interest rates, shorting stock becomes more
> profitable than buying puts, as the former generates income
> and the latter does the opposite. Thus, put option prices are
> impacted negatively* by increasing interest rates.
Interest rates are actually part of the Black-Scholes model of option pricing. Again, per Investopedia:
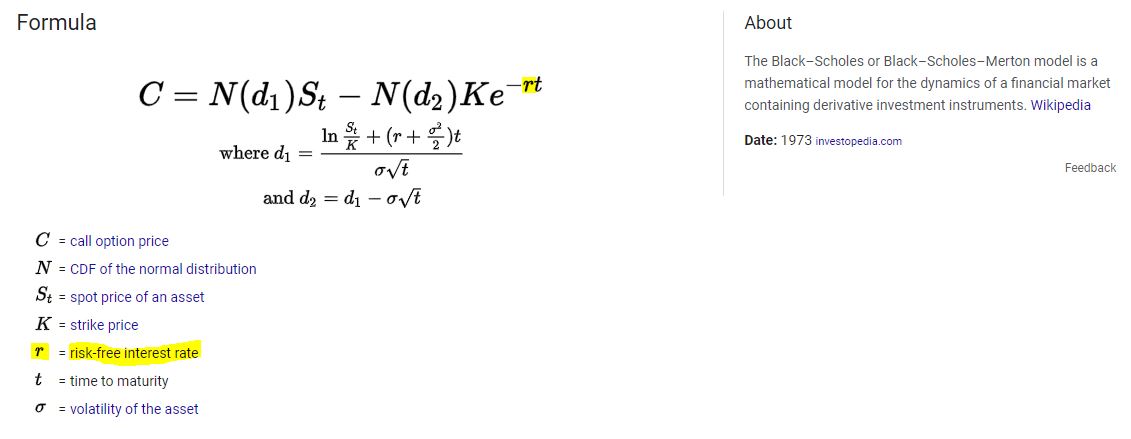
This shows call pricing as a function of two complex terms. The second term is subtracted and interest rates (greek letter rho highlighted in yellow) are in the denominator of this second term. As interest rates increase, the denominator increases thereby reducing the second term leaving—since less ends up being subtracted—a higher call price.
I will continue next time.
* — Lower demand can negatively impact put prices.
Categories: Option Trading | Comments (0) | PermalinkInvesting in T-bills (Part 8)
Posted by Mark on March 1, 2024 at 11:41 | Last modified: March 28, 2024 13:54The last table in Part 7 shows pricing data for synthetic long stock (SLS) positions in SPX: a combination of different expirations and strike prices. This brings me to a shocking revelation.
Walking the chain reveals loss from holding the SLS position. This means looking forward in time to get an idea what pricing will be like if “all else remains equal.” 91 days from now, the Sep position—now 182 DTE with a cost of $76.90—will be 91 DTE. Looking at the 91 DTE option chain (hence “walking the chain”) today (Jun expiration) shows the Jun 5275 SLS costs $21.10. 63 days after that, the Sep position would be like today’s Apr position with 28 DTE: established for an $18.40 credit. What I originally purchase for $76.90 will cost me an additional $18.40 to close in 154 days. That represents a loss of $76.90 + $18.40 = $95.30 or $9,530 per contract.
Say what?
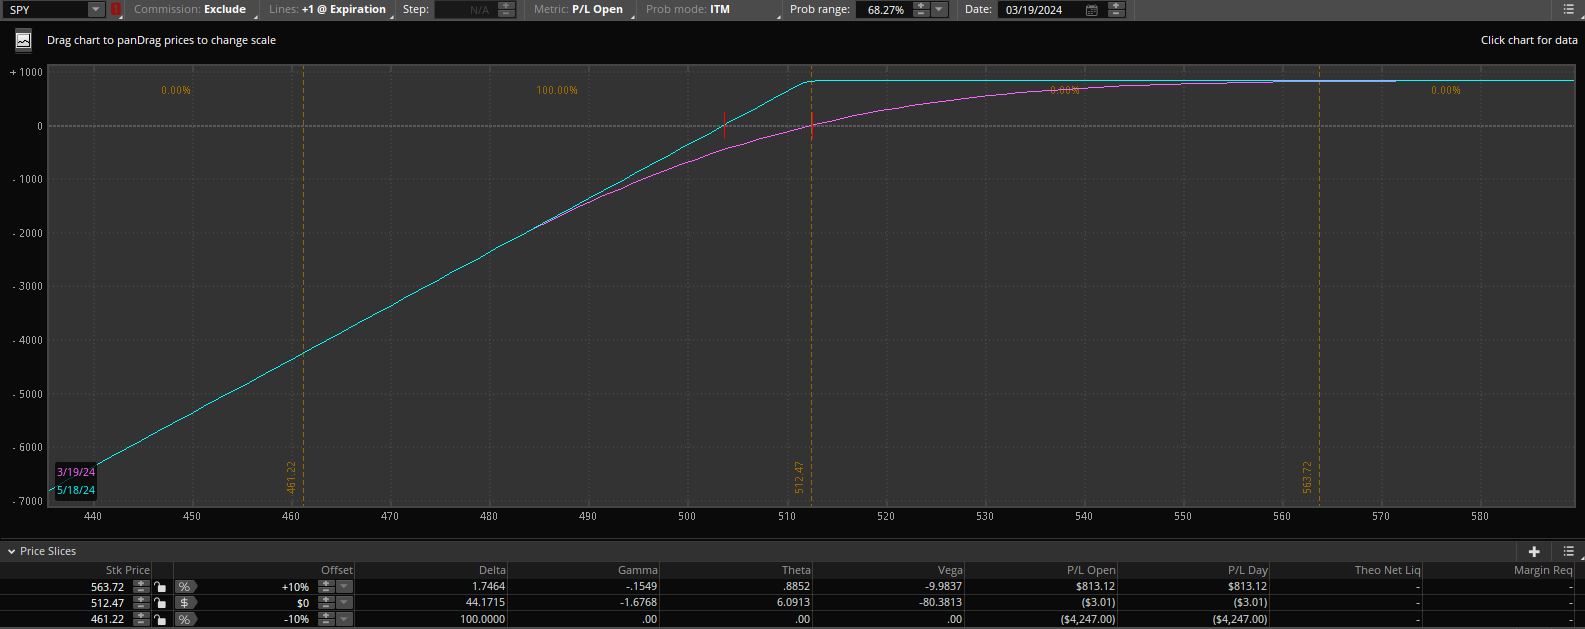
The risk graph provides confirmation:
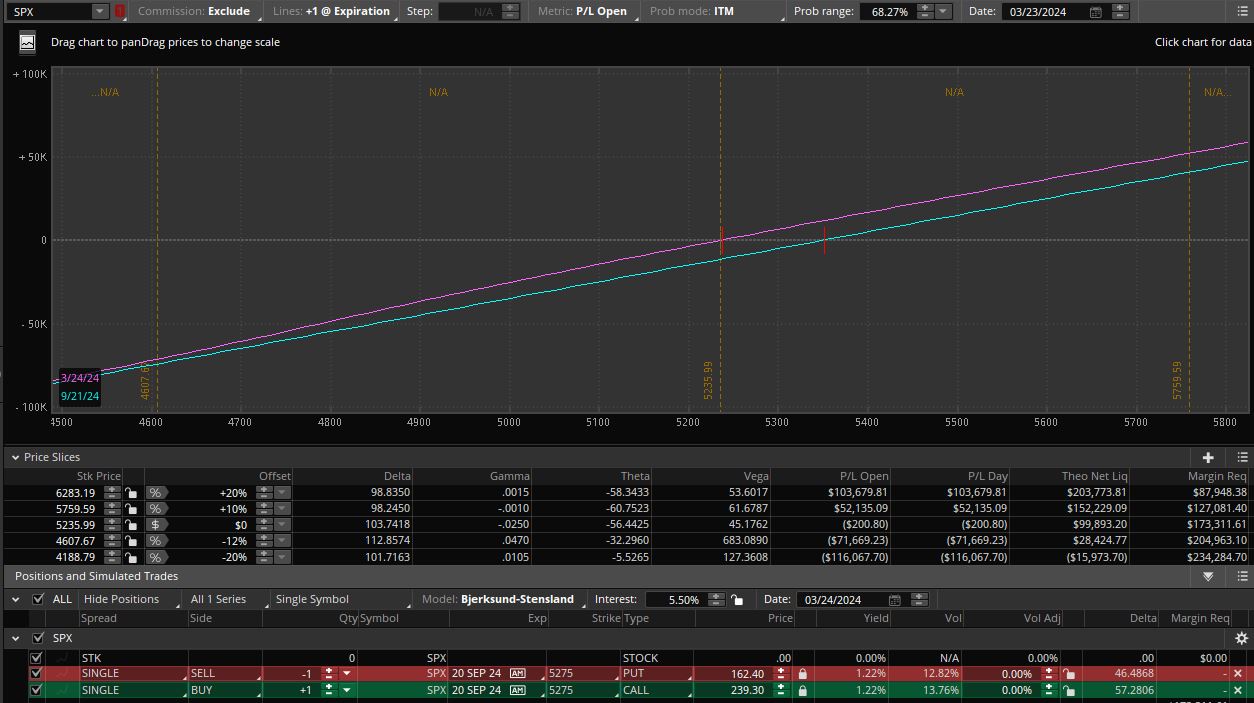
The purple line on 3/21/24 shows a current PnL of -$219.59. The cyan line on 9/21/24 shows a PnL in 182 days of -$11,609.10. This is a loss of $11,389.53. The SLS saves $523,599 (cost of 100 shares) – $7,690 (cost of SLS) = $515,909 for a [all-else-remains-equal] cost of (11,389.53 / 515,900) * (182 / 365) * 100% = 4.43%/year of the capital saved.
Let’s review.
I have been exploring the idea of trading SLS + T-bills as a way to get equivalent long stock exposure and bond interest.
I just discovered that trading the SLS incurs a cost that offsets much of the interest paid by T-bills.
What we have is another instance [so often heard when studying investing/trading/finance] of “no free lunch.” Also coming to mind is “can’t eat your cake and have it too.”
I had been starting to think trading SLS and investing in T-bills might provide an edge over buying the long stock outright. Rather than a potential edge to be had, I now see it more like a detriment suffered if T-bills are not purchased while holding the SLS. As an option trader with lots of free cash, T-bills must be purchased to avoid missing out on what is basically free money. As a more traditional equity investor, while T-bills still appear to be the better deal (by roughly 0.47%), I’m not convinced going the SLS route is worth doing given the remaining considerations when comparing the two.
I’d be lying if I denied any presence of sour grapes right now. The Options Playbook says:
> For… [SLS], time decay is somewhat neutral. It will erode the value of the option
> you bought (bad) but it will also erode the value of the option you sold (good).
Nothing could be farther from the truth in today’s environment.
I will continue next time exploring why this might be.
Categories: Option Trading | Comments (0) | PermalinkInvesting in T-bills (Part 7)
Posted by Mark on February 27, 2024 at 10:26 | Last modified: March 25, 2024 15:04Before continuing to compare stock investing (S&P 500 ETFs and mutual funds, in particular) with synthetic long stock / T-bills, I have some other loose ends to tie up.
Let’s detail the first footnote from Part 4:
> The call is more expensive than the put because it includes over
> $2.00 intrinsic value. This is touched upon in the third paragraph
> here,but I would refer you to an introductory book/article on options
> for a more complete explanation. For at-the-money equity
> options, puts [premiums] are generally more expensive than calls.
The Options Playbook echoes this:
> If the stock price is above strike A, the long call will usually cost
> more than the short put. So the strategy will be established for a
> net debit. If the stock price is below strike A, you will usually
> receive more for the short put than you pay for the long call so
> the strategy will be established for a net credit. Remember: the
> net debit paid or net credit received to establish this strategy will
> be affected by where the stock price is relative to the strike price.
As I write in this sixth paragraph:
> Lots of ideas from financial professionals and investment gurus
> sound good, but I believe the only way to understand what has
> truly worked is to analyze the data.
Let’s turn to some data in the form of option chains from three different expirations:
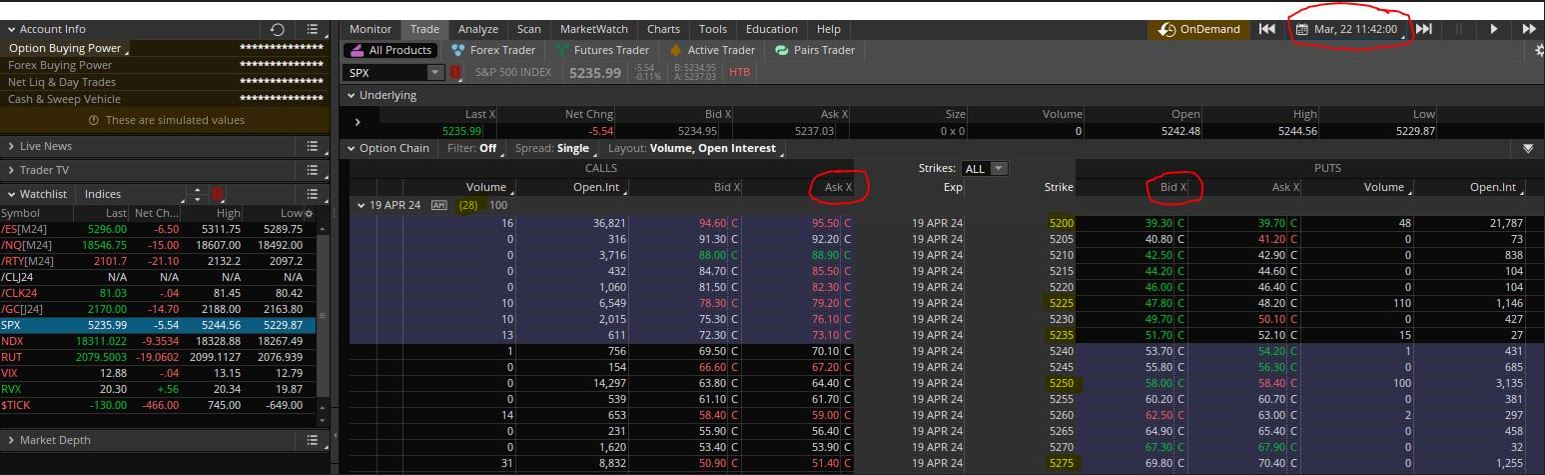
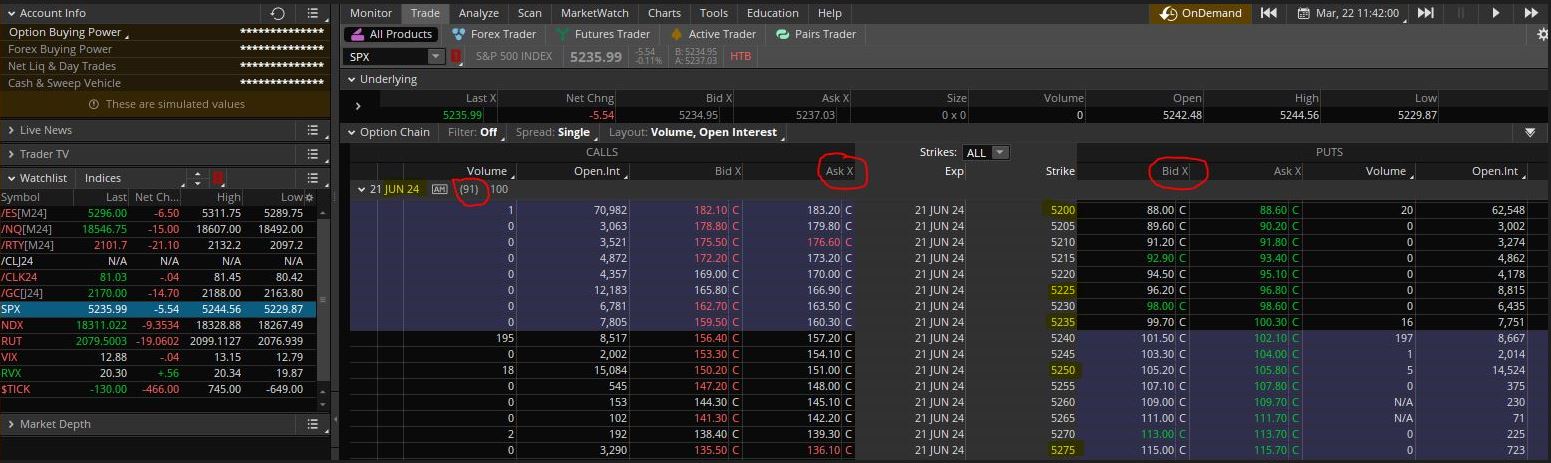
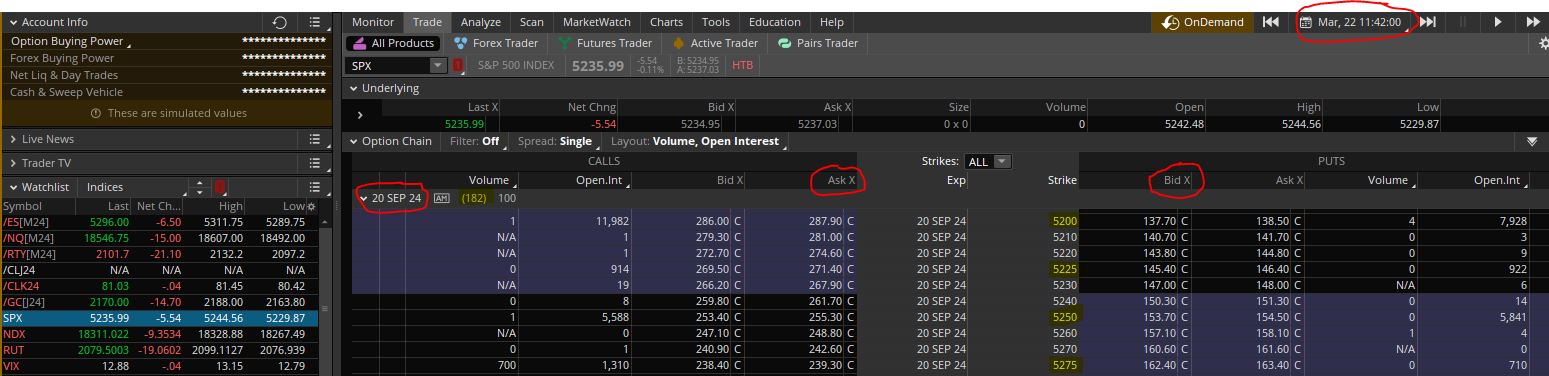
Extracting data from the circled columns, date, and highlighted strikes:
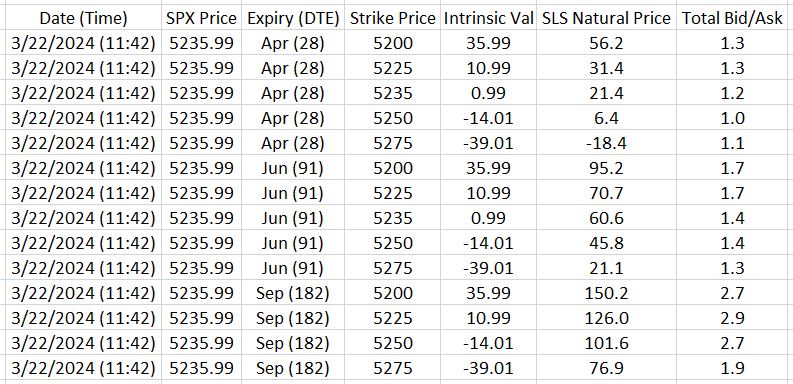
“SLS [Synthetic Long Stock] Natural Price” is the call [ask] premium minus put [bid] premium.
“Total bid/ask” is the sum of the ask premium minus bid premium for both call and put.
Although intrinsic value (strike price minus underlying price for puts and underlying price minus strike price for calls) is nonnegative, I have used a positive (purchase) and negative (sale) sign for calls and puts, respectively, in the “Intrinsic Val” column. This facilitates evaluation of the hypothesis that intrinsic value in calls (puts) makes SLS price higher (lower).
SLS price does indeed go down as intrinsic value shifts toward the puts.
In only one instance out of 14 is SLS price negative, however. I expected SLS of equal and opposite moneyness to have equal and opposite price (as Options Playbook implies above). A closer look at the option chains reveals calls in these near-the-money strikes to be more expensive than puts. This runs contrary to traditional wisdom about vertical skew ever since Black Monday (1987) and demands further research.
But wait: there’s more!
Next time I will continue with the most shocking revelation of all.
Categories: Option Trading | Comments (0) | PermalinkInvesting in T-bills (Part 6)
Posted by Mark on February 22, 2024 at 13:24 | Last modified: March 24, 2024 08:57Today, I continue addressing the first consideration when comparing stock investing (S&P 500 ETFs and mutual funds, in particular) with synthetic long stock / T-bills.
As mentioned in the second-to-last paragraph of Part 5, synthetic long stock requires advanced trading permissions from the broker [score one point for stock investing]. I think this is mainly due to a need for close monitoring as expiration approaches and knowledge required about proper management depending on whether the underlying has gone up or down.
If the underlying (ETF) has increased through expiration,* the long call must be sold [thereby incurring slippage, commission, and exchange fees—score another point for stock investing] because automatic exercise will occur if in-the-money (ITM) by at least $0.01. This cannot be allowed to happen because avoiding stock purchase is precisely why the synthetic is being traded in the first place. The short put can probably be left to expire with close monitoring for sudden downside movement if the ETF is trading anywhere near the stock price** in order to prevent what I will describe next.
If the underlying has decreased through expiration,* the short put must be bought (to close) [again incurring slippage, commission, and exchange fees]. The short put may be assigned early if it goes deep ITM or assigned at/near expiration if it is even slightly ITM. Extrinsic value is something to be monitored; if this shrinks to a penny or two,*** then immediate closing (rolling) is prudent. Any extrinsic value in the long call could be salvaged by a sale. In fact, for the synthetic long stock to perfectly mimic gain/loss of the underlying shares, both options should be closed together and concomitantly replaced with a later-dated position.****
I have at least two ideas to significantly limit assignment risk. First, avoid expiration week altogether by rolling synthetic long stock no later than 7 DTE. Especially if positions are established far from expiration, the difference between rolling at 7 DTE vs. expiration week proper is trifling. Second, trade the synthetic with SPX options rather than SPY. Any assignment of SPX options results in a cash credit/debit for the difference between strike price and underlying [SPX index] price rather than an obligation to buy the full 100 shares of SPY [multiplied by number of contracts].
I will continue next time with a brief discussion of option liquidity for S&P 500 ETFs.
* — Assuming an at-the-money synthetic stock position at inception, which need not be the case.
** — This applies more to PM-settled options that can be monitored right up to expiration. Closing
AM-settled by 4:15 PM ET (check option specifications for exact trading hours) is prudent
when trading within a couple (few?) standard deviations of the strike price to limit chances
of a big overnight move resulting in assignment.
*** — $0.05 – $0.10 for SPX options
**** — “Concomitantly” makes this a theoretical impossibility but opening a new synthetic long
stock position ASAP after closing the existing is sufficient.
Investing in T-bills (Part 5)
Posted by Mark on February 20, 2024 at 11:37 | Last modified: March 20, 2024 21:37Having now completed the comparison between long calls and short puts, we’re now ready to consider both at once.
A long call and short put opened at the same strike price produce a risk graph that may look familiar:
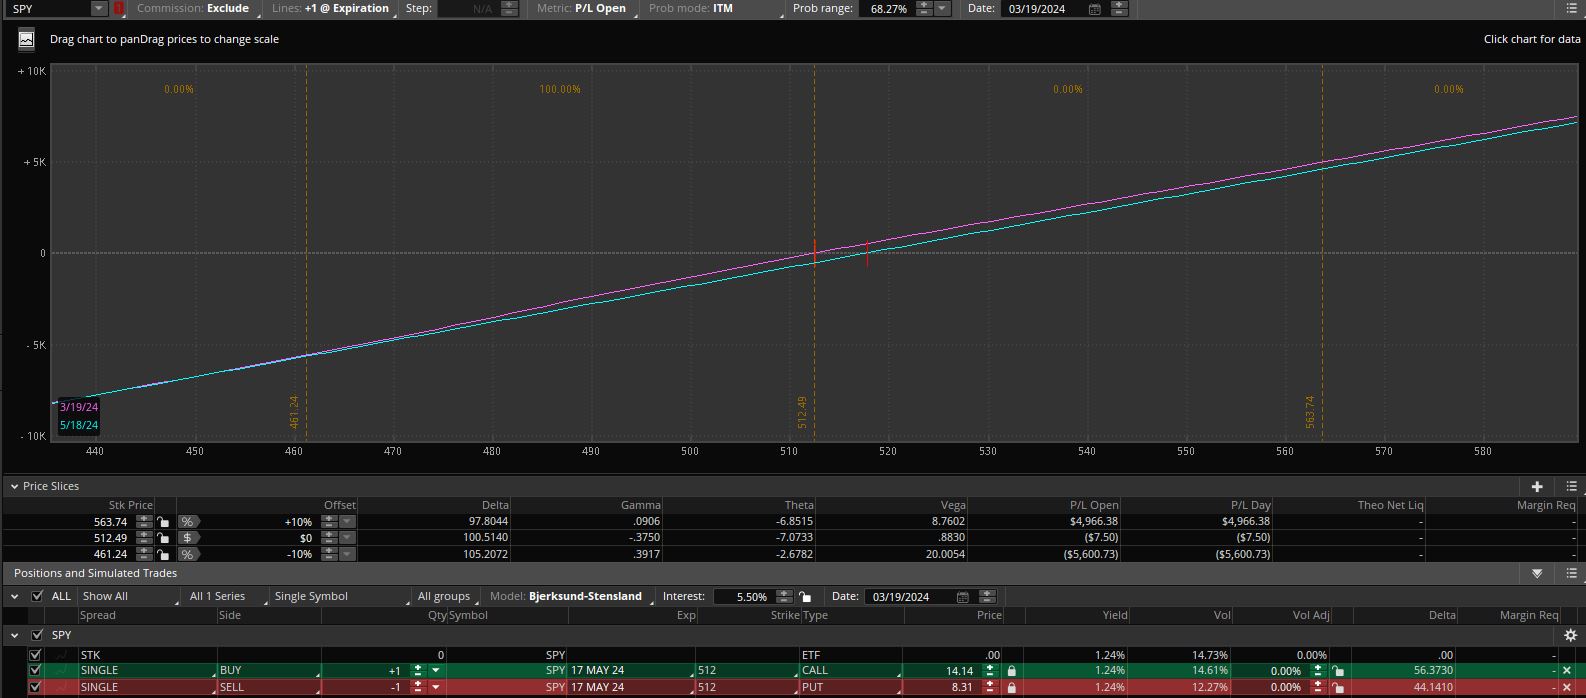
This is known as synthetic long stock. One contract of each option will be virtually identical to 100 shares of the underlying stock (SPY ETF in this example) with regard to profit/loss.
Here are the vitals:
- The cost to open this position is $14.14 – $8.31 = $5.83/contract (or $583 compared to $51,220 to buy the stock).
- The purple (cyan) curve shows profit and loss today (in 59 days at May expiration) based on a range of prices for SPY.
- Like stock, this has unlimited profit potential and maximum loss to be realized if SPY goes to zero at expiration.
For purposes of T-bill investment, the cost savings is paramount: $51,220 – $583 = $50,637 saved via synthetic stock can buy T-bills for a guaranteed [by the full faith and credit of the United States government] return of [currently] over 5.0% per year.
This blog mini-series has led to exploration of synthetic long stock as a higher-performance alternative to stock shares. Most people who invest in mutual funds or ETFs are committing the full $51,220 mentioned above without any T-bill exposure. What about trading options for a fraction of the cost and getting 5%/year on the difference?
I can’t find any supporting statistics, but I would venture to say investment in S&P 500 index mutual funds and/or S&P 500 ETFs are the most popular equity investments in existence (coming in a close second may be total stock market funds/ETFs). S&P 500 vehicles are offered in every retirement plan I have ever seen, heard of, or read about. Most articles I study in financial journals use these index mutual funds or ETFs (e.g. SPY, IVV, VOO) as a proxy for equity investment performance. They also have among the lowest expense ratios and narrowest bid/ask spreads of any issues traded on Earth.
The first of several considerations to be made when comparing long stock to synthetic long stock / T-bills is option trading permissions. Option trading levels range from beginner to advanced and different brokers have different categories. TD Ameritrade has three “tiers” while Interactive Brokers has four levels of “option trading permissions.” Most novice traders and IRA accounts receive basic authorization that enables use of covered calls and long call or put contracts. This requires some basic options knowledge and a cash or IRA account with enough funding. More advanced authorization usually requires a margin account. Since the broker risks losing money by lending funds, these levels require some options trading experience and sufficient funds or assets in the account to cover any losses.
The short put places synthetic long stock into a more advanced option trading category. Not being applicable to everyone is a disadvantage because it would therefore require added cost for an authorized trader (investment advisor) to manage.
I will continue next time.
Categories: Option Trading | Comments (0) | PermalinkInvesting in T-bills (Part 4)
Posted by Mark on February 16, 2024 at 10:18 | Last modified: March 19, 2024 12:14I discussed put selling (also known as “short puts” or “naked puts”) last time as a way to participate in underlying stock appreciation in combination with T-bill investing. Before moving forward, I want to tie up some loose ends and present a different way of visualizing previous concepts.
Risk graphs are a way of visualizing potential risk and reward of option positions. I compared and contrasted such details for long calls and short puts in Part 3.
Here is the risk graph for a long call:
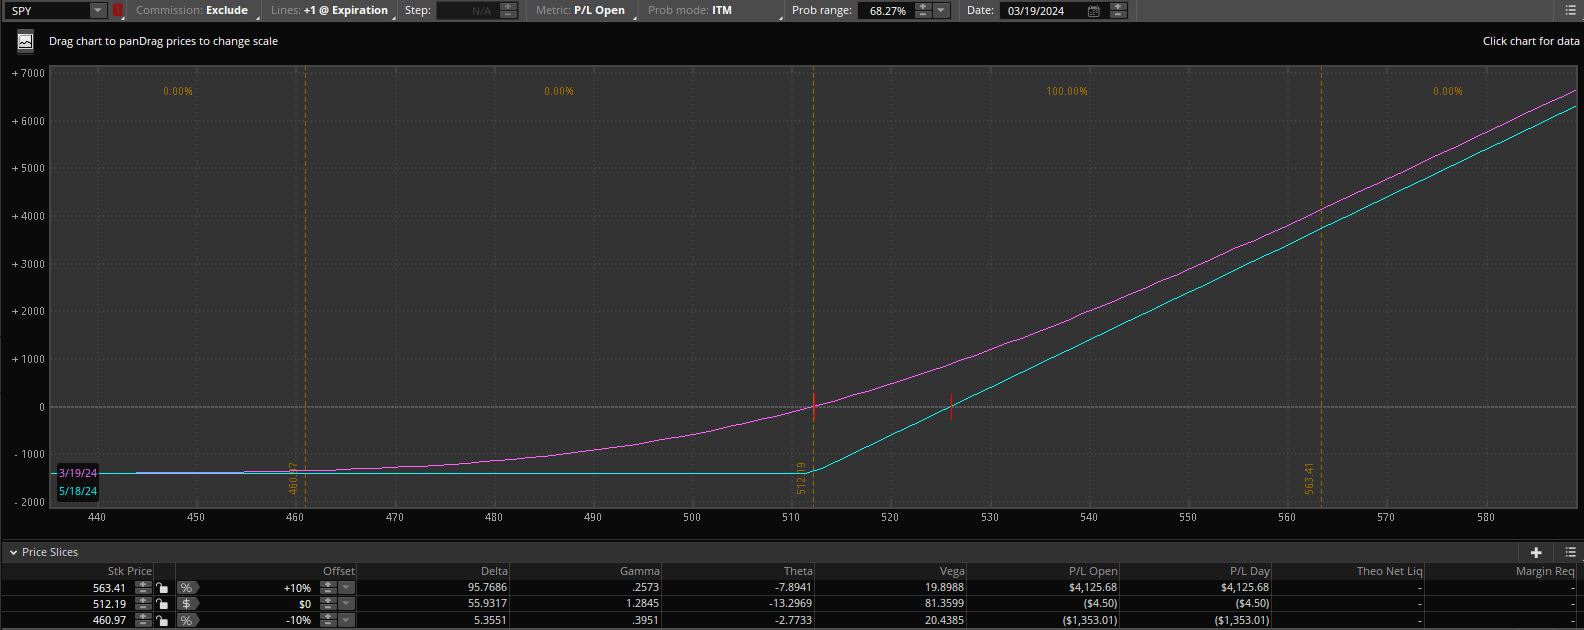
- This call is purchased for $14.14/share (the default multiplier for equity options is 100 shares per contract so buying one of these actually costs $14.14 * 100 = $1,414) with SPY [stock, or more precisely ETF] at $512.20/share (early morning on 3/19/24; see second-to-last paragraph here if the dates really confuse you).
- The purple (cyan) curve shows profit and loss today (in 59 days at May expiration) based on a range of prices for SPY.
- Note how the purple curve will sink down to the cyan over time. This represents the premium paid for the call and how some of that premium may be recovered by selling to close prior to expiration (total premium is reflected in the value of the cyan curve to the left: -$1,414).
- Note the unlimited profit potential as the curves have positive slope to the right.
Here is the risk graph for a short put:
- This put is sold for $8.31/share ($831/contract) with SPY at $512.40/share (early morning on 3/19/24).*
- The purple (cyan) curve shows profit and loss today (in 59 days at May expiration) based on a range of prices for SPY.
- Note how the purple curve rises to the cyan over time. This represents the premium received for the put and how some of that premium must be surrendered when buying to close prior to expiration (total premium is reflected in the value of the cyan curve to the right: +$831).
- Note the unlimited [technically limited by SPY reaching zero because stock prices cannot go negative] loss potential as the curves have negative slope to the left.**
Buying calls depletes whereas selling puts raises cash that may be used to invest in T-bills. If the calls become profitable, however, then selling them will increase cash balance whereas closing a short put (or letting it expire) after the underlying stock has decreased can lower cash balance (more on this later).
I will continue next time.
* — The call is more expensive than the put because it includes over $2.00 intrinsic value. This is touched upon in
the third paragraph here, but I would refer you to an introductory book/article on options for a more complete
explanation. For at-the-money equity options, puts [premium] are generally more expensive than calls.
** — One naked put carries less risk than 100 shares of stock because its maximal loss is offset by the premium
received for selling it. This is discussed in further depth here.