Investing in T-bills (Part 4)
Posted by Mark on February 16, 2024 at 10:18 | Last modified: March 19, 2024 12:14I discussed put selling (also known as “short puts” or “naked puts”) last time as a way to participate in underlying stock appreciation in combination with T-bill investing. Before moving forward, I want to tie up some loose ends and present a different way of visualizing previous concepts.
Risk graphs are a way of visualizing potential risk and reward of option positions. I compared and contrasted such details for long calls and short puts in Part 3.
Here is the risk graph for a long call:
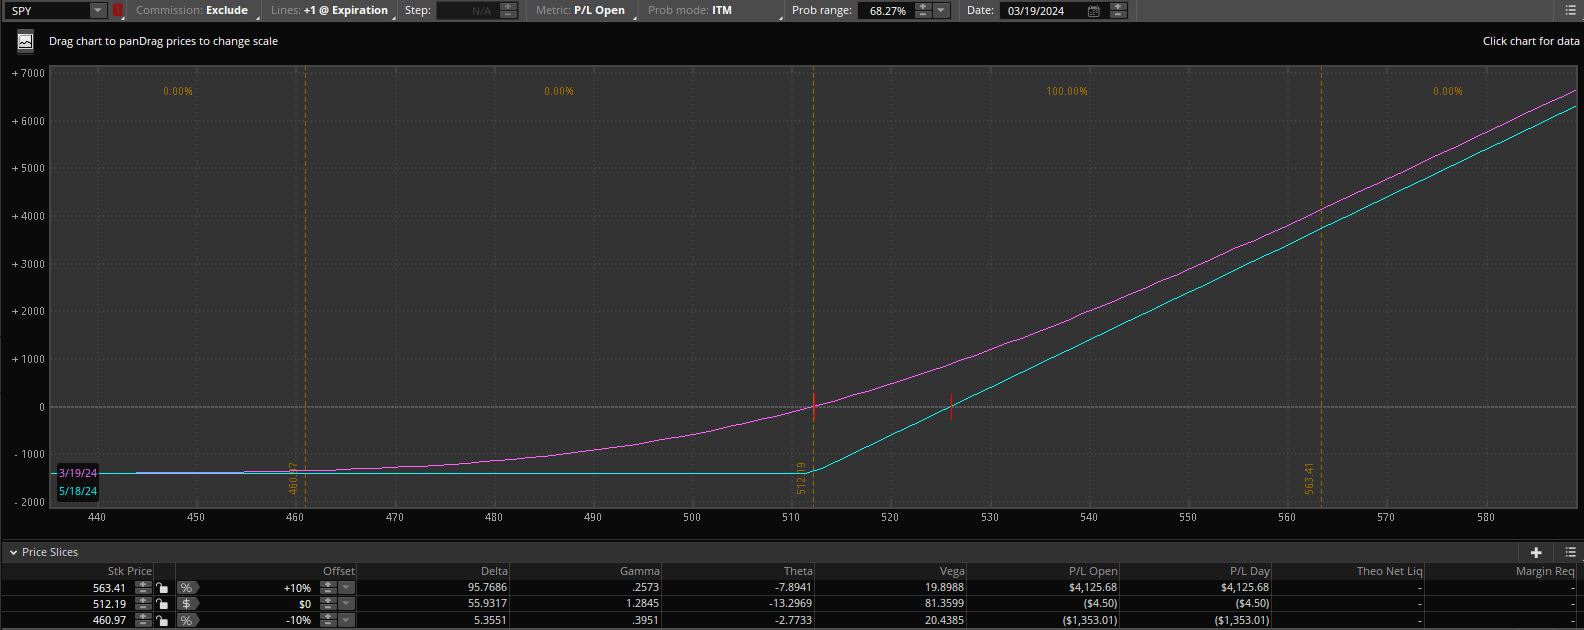
- This call is purchased for $14.14/share (the default multiplier for equity options is 100 shares per contract so buying one of these actually costs $14.14 * 100 = $1,414) with SPY [stock, or more precisely ETF] at $512.20/share (early morning on 3/19/24; see second-to-last paragraph here if the dates really confuse you).
- The purple (cyan) curve shows profit and loss today (in 59 days at May expiration) based on a range of prices for SPY.
- Note how the purple curve will sink down to the cyan over time. This represents the premium paid for the call and how some of that premium may be recovered by selling to close prior to expiration (total premium is reflected in the value of the cyan curve to the left: -$1,414).
- Note the unlimited profit potential as the curves have positive slope to the right.
Here is the risk graph for a short put:
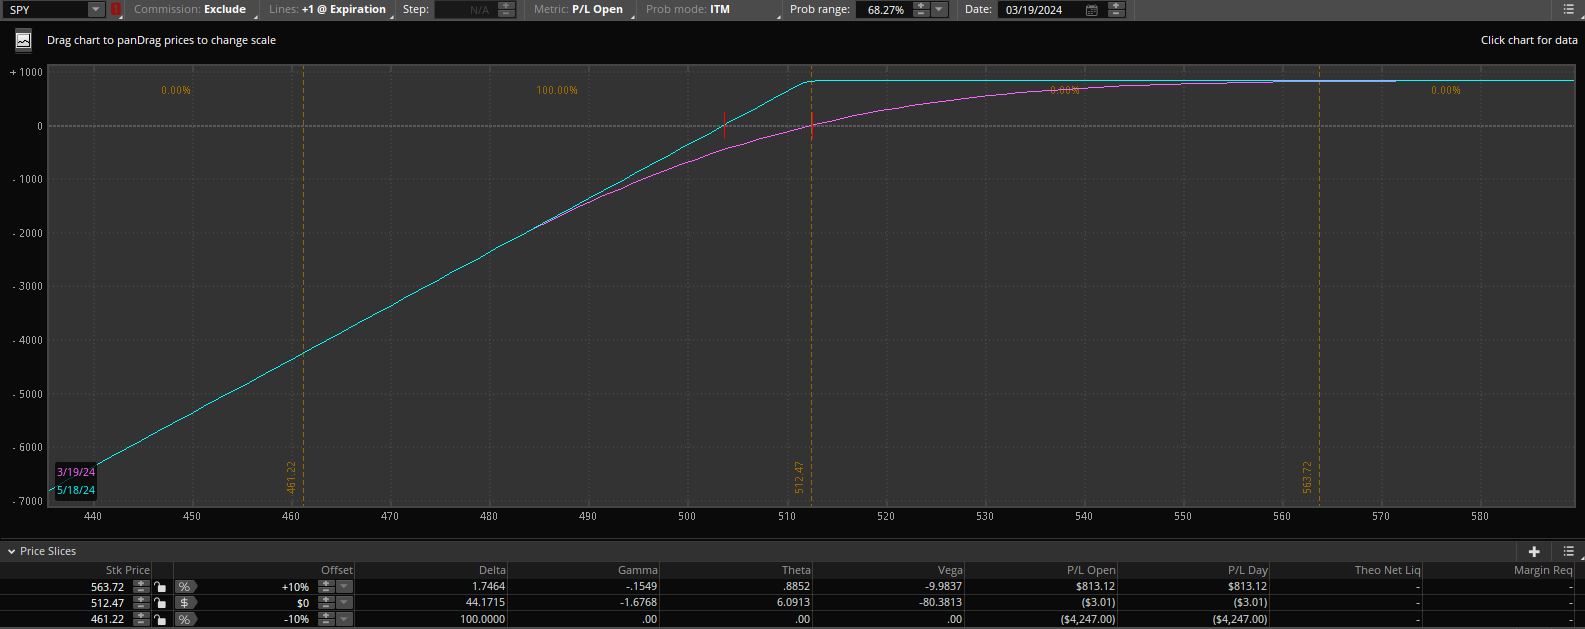
- This put is sold for $8.31/share ($831/contract) with SPY at $512.40/share (early morning on 3/19/24).*
- The purple (cyan) curve shows profit and loss today (in 59 days at May expiration) based on a range of prices for SPY.
- Note how the purple curve rises to the cyan over time. This represents the premium received for the put and how some of that premium must be surrendered when buying to close prior to expiration (total premium is reflected in the value of the cyan curve to the right: +$831).
- Note the unlimited [technically limited by SPY reaching zero because stock prices cannot go negative] loss potential as the curves have negative slope to the left.**
Buying calls depletes whereas selling puts raises cash that may be used to invest in T-bills. If the calls become profitable, however, then selling them will increase cash balance whereas closing a short put (or letting it expire) after the underlying stock has decreased can lower cash balance (more on this later).
I will continue next time.
* — The call is more expensive than the put because it includes over $2.00 intrinsic value. This is touched upon in
the third paragraph here, but I would refer you to an introductory book/article on options for a more complete
explanation. For at-the-money equity options, puts [premium] are generally more expensive than calls.
** — One naked put carries less risk than 100 shares of stock because its maximal loss is offset by the premium
received for selling it. This is discussed in further depth here.