Investing in T-bills (Part 19)
Posted by Mark on March 28, 2024 at 11:04 | Last modified: April 11, 2024 12:04I’ve covered a lot of quality detail in this mini-series involving T-bill investing, option trading, municipal bonds, and margin requirements. I will finish today tying up a few other loose ends.
Despite the title “Investing in T-bills,” some may actually consider it trading. As discussed in the fourth paragraph of Part 12, my bond-ladder structure requires a T-bill purchase every week. This may be deemed frequent for those who associate “investing” with long-term buy-and-hold (i.e. few required and/or infrequent transactions). I consider it investing in terms of maintaining an interest-generating vehicle over a longer-term period, but it does require a minimal time commitment.
Prior to the Part 8 revelation that overall option decay of synthetic long stock (SLS) substantially weakens its candidacy as a proxy for long shares, I had two other thoughts about taking advantage.
First, using only long calls instead of [together with short puts to form] SLS would limit the unlimited [to zero] downside risk. Something similar can be accomplished by purchasing roughly half the number of shares and using remaining free cash to invest in T-bills. The capital requirement of half the shares would still be greater than either long calls or SLS, but shares are not subject to the additional payment for time premium.*
Despite the weakened candidacy mentioned above, long calls carry a different risk profile than [SLS or] long stock; backtesting could be used to determine what strategy might be superior.
Second, SPX SLS may be a good proxy for any large-cap ETF or mutual fund. Edge realized by large-cap ETFs or mutual funds that beat the S&P 500 [in some years, at least] would be more than offset by the additional 5.0% return on capital saved by trading SLS instead of long shares.
The Dimensional US Large Company Portfolio (DFUSX) is one such example that does not bear out as advertised. A couple years ago, I spoke with an investment adviser (IA) who uses Dimensional Funds for clients. By retaining most benchmark components while excluding just a few, he said, Dimensional funds outperform. On 4/11/24, I looked at DFUSX holdings (as of 2/29/24) to find 504 stock holdings. The most-recent S&P 500 update I can find (Investopedia from 9/26/23) reports 500 companies have issued 503 total stocks. At 504, DFUSX has added and either not excluded or substituted thereby contradicting the IA. DFUSX also has a somewhat-perplexing 505th position: S&P 500 futures. With stock futures usually in contango, this represents a slight drag over time.
SLS no longer seems like a good proxy for DFUSX given the weakened candidacy mentioned five paragraphs above.
In summary, I would avoid SLS as a proxy for long shares to be used for non-option traders [paying an option-trading IA to manage]. While I think T-bills [or something comparable] are a necessary component to supplement an option portfolio, SLS may be a poor proxy even for option traders given the additional expenses related to taxes and transaction fees.**
* — Suggesting that even before the Part 8 discovery, I knew about the time premium expense—
just not how much more time premium is lost by the long call than gained by the short put.
** — As mentioned in this second paragraph, I need to expand the sample to verify the ~0.5%
SLS edge.
Investing in T-bills (Part 18)
Posted by Mark on March 25, 2024 at 16:11 | Last modified: April 11, 2024 09:07As mentioned in the last full paragraph of Part 4, selling puts facilitates T-bill investment by raising cash balance. Short puts are proportional to overall risk, however, and such transactions are subject to specific maintenance margin requirements (MR).
[Initial MR is equal to] Maintenance MR for short puts [and] is calculated differently than that discussed for equities in Part 16. MR is the greatest of:
- Current market value of option(s) + 20% of underlying stock – amount out of the money (OTM; otherwise zero) [1]
- 10% of exercise value of underlying stock + premium value [2]
- Premium value + $50/contract [3]
Example #1: sell six short puts on ABC (stock) at $80 strike price for $2.50 each with ABC at $81.25/share
[1] ($2.50 x (6 x 100)) + [(20% / 100) x ($81.25 x (6 x 100))] – (($81.25 – $80.00) x 600) =
$1,500 + $9,750 – $750 = $10,500
[2] [(10% / 100) x ($80 x (6 x 100))] + ($2.50 x 600) = $4,800 + $1,500 = $6,300
[3] ($2.50 x 600) + ($50 x 6) = $1,500 + $300 = $1,800
$10,500 is greatest (the 20% MR [1]).
Example #2: sell six short puts on XYZ (stock) at $70 strike price for $0.75 each with XYZ at $81.25/share
[1] ($0.75 x (6 x 100)) + [(20% / 100) x ($81.25 x (6 x 100))] – (($81.25 – $70.00) x 600) =
$450 + $9,750 – $6,750 = $3,450
[2] [(10% / 100) x ($70 x (6 x 100))] + ($0.75 x 600) = $4,200 + $450 = $4,650
[3] ($0.75 x 600) + ($50 x 6) = $450 + $300 = $750
$4,650 is greatest (the 10% MR [2]). This is just Example #1 with a lower strike price (hence lower premium) selected.
MR is proportional to number of contracts because the latter gets multiplied by every term in each calculation. In Example #2, MR is therefore $4,650 / 6 contracts = $775/contract. For 12 puts, MR would be: 12 x $775/contract = $9,300.*
A maintenance call (see fifth bullet point) will be issued when:
MR > market value of securities + free cash – debit balance [4]
- Market value of long (short) securities is positive (negative).
- Market value of OTM short options increases to zero at expiration.
- Debit balance is the loan amount when borrowing funds from the brokerage.*
- Customers typically have two business days to satisfy a maintenance call by falsifying [4] else the brokerage will close positions at its discretion (potential worst-case scenario as catastrophic loss may be locked in).
While short puts increase cash balance, hopefully it’s now clear they are subject to MR limitations regarding max quantity with direct implications for risk.
Initial MR for long options is 100% of the purchase price. Cash balance decreases upon purchase and no maintenance MR subsequently applies.
As a reminder, synthetic long stock (SLS) is a combination of long call(s) and short put(s) at the same strike [price].
That light at the tunnel is getting quite bright!
*–MR is not to be confused with margin loan (“debit balance” in [4]) that occurs when cash balance goes negative.
Investing in T-bills (Part 17)
Posted by Mark on March 23, 2024 at 08:51 | Last modified: April 10, 2024 09:26Higher initial/maintenance margin requirements is one reason why option traders may choose [taxable] T-bills [interest] over tax-exempt munis. Another reason to favor T-bills is the muni bond de minimis rule.
I want to clarify interest on zero-coupon T-bills as discussed in the third-to-last full paragraph of Part 16. These are taxed as if interest income were being received even though no income is actually received until the bond matures. Whether price appreciation to par or a semi-annual coupon payment, both are taxable interest as far as Uncle Sam is concerned.
As far as munis (issued by state, city, and local governments) go, interest is generally free from federal taxes and is:
- Usually free from state tax in the state of issuance.
- Not taxed by some states regardless of the state of issuance.
- Sometimes exempt from state tax at the time of issuance by that same state even when said state usually taxes them.
Unlike muni interest, bond price appreciation is usually taxed in accordance with the de minimis rule. At issue is whether price appreciation will be taxed as ordinary income or as capital gains. This is done as follows:
- Multiply the face value by 0.25%.
- Multiply that result by number of full years between bond purchase and maturity date to get de minimis discount.
- Subtract de minimis discount from muni par value to get the minimum purchase price.
- If actual purchase price is less (equal to or greater) than the minimum purchase price, price appreciation on the bond is subject to ordinary income (capital gains) tax rates.
For example, imagine $97.75 purchase of 10-year muni paying 4.00% APY with par value of $99 and six years until maturity.
De minimis discount = $99 x (0.25% / 100) x 6 = $1.485
Minimum purchase price = $99 – $1.485 = $97.515
Because $97.75 > $97.515, price appreciation will be taxed as capital gains. If held for over one year (one year or less), then capital gains tax rates are lower than (equal to) ordinary income tax rates.
The de minimis risk [of having to pay ordinary tax rates on price appreciation] is greater in rising interest rate environments. Since interest rates are inversely proportional to bond prices, increasing rates are associated with decreased bond prices.
One case where price appreciation may be tax-exempt is a zero-coupon municipal bond. These are always bought at a discount since they make no interest/coupon payments and price appreciation to par value is usually not taxed. The biggest caveat seems to be selling before the maturity date. In this instance, any price change realized on zero-coupon munis will be treated as a [short- or long-term depending on holding period] capital gain or loss.
Is that light at the end of the tunnel I see?
I will continue next time.
* — The Part 11 disclaimer applies: please consult a tax advisor for the definitive word on these matters.
Investing in T-bills (Part 16)
Posted by Mark on March 22, 2024 at 09:43 | Last modified: April 10, 2024 09:46Last time, I began to explore the idea of trading options on top of tax-exempt munis since interest on T-bills is taxed at the Federal level. Today I continue the discussion with regard to maintenance margin requirements.
Let’s define two new terms: initial margin and maintenance margin. Initial margin is the percent of purchase price that must be paid with cash in a margin account. Maintenance margin, currently set at 25% of the total securities value per Financial Industry Regulatory Authority requirements, is the amount of equity that must be kept in the margin account going forward.
Maintenance margin for equities is best illustrated by a table:
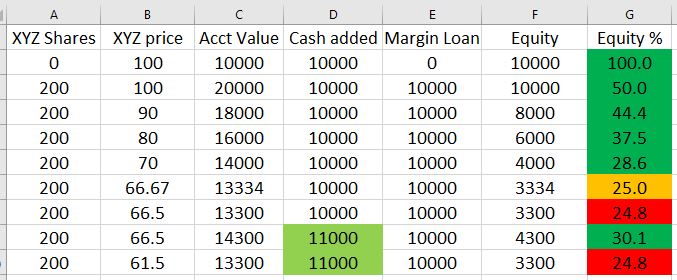
- A margin account is opened by depositing $10,000 (column D).
- Using the $10,000 free cash and $10,000 borrowed from the brokerage (column E), 200 shares of XYZ are purchased at $100/share causing an equity percentage [col G = 100 * (col C – col E) / col C] drop to 50%.
- Equity percentage drops further as the share price drops.
- When XYZ hits $66.67/share, equity percentage is at the minimal threshold of 25%.
- At $66.50/share (a drop of 33.5% from initial purchase price), equity percentage is below threshold. Brokerage will issue a margin call forcing deposit of more cash or securities to avoid sale of XYZ at a big loss.
- Depositing an additional $1,000 (now $11,000 total in column D) restores equity percentage (30.1%) above the minimum threshold where it will remain unless XYZ drops to $61.50/share resulting in a subsequent margin call.
Although taxable, T-bill interest qualifies for 1% initial and maintenance margin for maturities up to six months. This means $100,000 of T-bills may be purchased while preserving $99,000 for option trading. Beware, though! This defines how much capital may be borrowed rather than how much should be invested. As stated in this third paragraph, capital should never be borrowed to invest in T-bills. T-bill investments count 100% against the cash balance* and margin loans begin if cash balance drops below zero (hence the 10% cash buffer mentioned in this second-to-last paragraph).
For the sake of option trading, low maintenance T-bill margin seems like a great deal that is actually just a necessary precaution (see bottom of Part 8) to prevent the brokerage from pocketing additional interest. While the customer gets paid 0.35% on free cash, the brokerage could invest that cash in T-bills to make 5% or more. I need to do more research to determine if this actually happens, but it seems plausible since T-bills are about as safe as any investment can get.
Disadvantaged margining for munis likely offsets their tax-exempt benefit. At my brokerage, initial and maintenance margin are the greater of 20% of the market value or 7% of the face value. I see another brokerage listing maintenance margin at 25% of bond market value (and initial at maintenance margin x 1.25). Either way, munis eat up at least 20x more in buying power than T-bills making them more likely to hamper option trading.
Next time we will study de minimis.
* — In contrast to naked puts that, as discussed in this last full paragraph, raise cash balance.
Investing in T-bills (Part 15)
Posted by Mark on March 20, 2024 at 09:41 | Last modified: April 7, 2024 10:46The meandering mini-series continues with some further comments about taxes and municipal bonds.
As a sidebar to what seems like a series of sidebars, meandering is not a bad thing with these blog posts. What ends up presenting is the opportunity to touch on a number of related subjects. Researching and writing about these topics helps me learn. Hopefully you can gain something too in the form of some well-rounded financial understanding.
Because T-bills (along with all Treasury bonds) are subject to Federal tax [exempt from state and local taxes], I often see the recommendation to hold them in tax-advantaged retirement accounts such as traditional or Roth IRAs. Traditional IRAs owe tax on bond interest only when funds are distributed (withdrawn) rather than as interest is earned. This allows for longer compounding. Roth IRA contributions are fully taxed up front allowing bond interest to be effectively tax-exempt.
Retirement accounts must be cash accounts. Cash accounts are not eligible for margin loans from the brokerage (“trading on margin”). Neither are cash accounts subject to initial and maintenance margin requirements* that enable certain types of option trading such as call writes and short puts.
To me, the cash-versus-margin-account delineation clarifies the bond recommendation from above. Fixed income (i.e. T-bills or other bonds) may be managed as one asset in a diversified portfolio (e.g. an allocation made up of 50% large-cap stocks, 20% small-cap stocks, and 30% fixed income) for which a cash account like an IRA is perfectly suitable. If using T-bills to maximize return on cash left over from option trades, however, then T-bills and options must be in the same account: likely a [option-enabled] margin account rather than an IRA (cash account). The above recommendation would not apply.
With tax on T-bill interest weakening the case for trading synthetic long stock + T-bills in lieu of long shares,** municipal bonds come to mind. “Munis” (municipal bonds) are tax-exempt. They are generally a better choice for higher tax brackets because the amount saved by not owing tax on bond interest taxed is greater. When comparing munis with other bonds, a “tax-equivalent yield” (TEV) is often calculated: TEV = muni yield / (1 – marginal tax rate***).
Given the T-bill from Part 12 paying 5.355% YTM, would a muni paying a 3.8% coupon be a better choice? Assuming a 24% tax bracket (marginal tax rate), the muni:
TEV = 3.800% / (1 – (24 / 100)) = 5.000%
All else remaining equal, in this case T-bill is the better way to go.
I will continue next time.
* — To be addressed later
** — Recall this comparison was the real purpose of the entire mini-series. As discussed in
the first paragraph of Part 11, I got my answer early.
*** — Marginal tax rate is the percentage at which my last dollar of taxable income is taxed.
Investing in T-bills (Part 14)
Posted by Mark on March 19, 2024 at 08:58 | Last modified: April 7, 2024 10:46In the fourth paragraph of Part 12, I mentioned creation of a bond (T-bill) ladder without explaining the what or why.
Bond laddering involves buying bonds with different maturity dates thereby enabling the investor to respond relatively quickly to interest rate changes. Investing in bonds maturing on the same date carries high reinvestment risk: being forced to roll over a large capital allocation of maturing bonds into similar fixed-income products with a much lower interest rate. The ladder therefore facilitates a steadier stream of cash flows throughout.
Reducing reinvestment risk and smoothing out interest payments is of limited importance to me since my T-bills mature within months. The Fed usually decides whether to raise/lower interest rates during its eight scheduled meetings per year (and rarely by more than 50 basis points at a time). Over 3-4 months, drastic interest rate changes have seldom been seen. T-notes (T-bonds) mature in 2-10 (20-30) years—periods of time over which large rate changes are more likely.
Limiting price risk is another benefit of bond laddering that doesn’t apply much to my short-dated T-bills. When interest rates rise, bond prices fall; this affects longer-dated more than shorter-dated bonds.* A worst-case scenario would be large portfolio allocation to long-dated bonds at the unexpected start of a rising interest rate environment followed by a catastrophic life emergency forcing bond sale at a substantially lower price to raise cash. Contrast this with an initial outlay of five equal tranches of capital to bonds maturing in 2, 6, 10, 20, and 30 years. The rising interest rates would not hurt the 2-, 6-, and 10-year T-notes nearly as much as the 30-year T-bonds.
One final benefit to bond laddering is liquidity improvement [of a fixed-income portfolio]. Although Treasurys tend to trade on a relatively liquid secondary market, bonds by their nature are not generally liquid investments and cannot be cashed in anytime without penalty. In the example just given, 20% of the total allocation matures after 2, 6, 10, 20, and 30 years making cash available in a relatively short period rather than having to wait 30 years for any (all) of it.
Liquidity improvement is the main reason I use a bond ladder. Should the stock market move sharply against me, I may need cash to close losing positions. Every week I get a cash-balance infusion when T-bills mature. Rather than reinvest, I can skip a T-bill purchase(s) and use the cash to manage option positions. In combination with the 10% cash buffer (see last two full paragraphs of Part 13), I will hopefully avoid having to borrow funds from my brokerage and paying high margin interest.
I will continue next time.
* — Duration is a bond’s change in price per 1% increase in rates.
Advance Posting
Posted by Mark on March 15, 2024 at 08:59 | Last modified: March 14, 2024 10:11I feel compelled to make a brief entry about my tendency toward posting blog entries in advance.
At the end of the first paragraph here, I write:
> The investing world hasn’t heard from me since.
Followers of this blog had actually been reading consistent posts through Groundhog Day of this year. My regulars probably also know that over the years, I typically post twice per week: Mon / Thurs or Tues / Fri (with an occasional tweak due to market holidays). In doing five stock studies per week for most of 2023, I had more than enough posts to meet my quota of two. I therefore kept posting farther in advance even though many weeks I’d publish an additional post on what should have been a day off. My entry dated 2-2-2024 was actually written 10-26-2023.
When I post is of no real consequence as long as I get the posts done. I appreciate my loyal readers coming along for the ride but ultimately, the blog is to hold me accountable for my projects and work. The last post illustrates what critical importance it plays to that end; without the blog, I might as well be—dare I say—retired??
Were this for my readers, then it would be fair for me to charge a small fee (somewhat reminiscent of the group proposed here except as a blog subscriber you would not be required to contribute content). I have used methodology discussed in this blog to make money for myself and you could surely do the same.
My blog is not monetized, however, and never has been. Not only do I make zero money from its maintenance, I pay a pretty penny between registering the domain name, subscribing to web hosting services, etc.
This will be a shorter post as I have no more to say on the matter. I’m also giving myself a slight break since I just got off the schneid. Despite being shorter, it fulfills my quota of two per week: a huge accomplishment not realized since last October! I remain 10 posts behind, but only readers who keep up with the blog live will notice because entries made in the near future will be backdated to fill in the holes (i.e. “posting in arrears” as opposed to “advance posting”).
To coin a phrase, it’s much ado about nothing.
Categories: About Me | Comments (0) | PermalinkGetting Off the Schneid
Posted by Mark on March 12, 2024 at 10:04 | Last modified: March 13, 2024 12:11I did an amazing thing last year with First Cut stock studies: 209 of them! Two hundred nine. The time required for data collection, completing a stock study guide and First Cut report, and blog posting averaged 3-4 hours thereby making for a substantial annual commitment. I began my journey with 55 studies between Sep – Nov 2022 before taking a 65-day break and resuming on Jan 12, 2023. I then did one study per trading day through Oct 26 before a technical glitch blocked access to the M* website through my local library. Expecting this would take days to fix, I waited. Days turned into weeks, however, and I fell off the wagon. The investing world hasn’t heard from me since.
During the interlude, my brain has been in a state of—hibernation? Unwelcomed sabbatical? I really don’t know! I’ve taken breaks before (such as the 2+ months mentioned above), but not this long. Everything else in my life has been proceeding as usual including my trading. Trading pays the bills and takes less than 30 minutes per day; thankfully no interruption has been seen there. In my mind, however, the “optional activities” discussed in these first three paragraphs are what make the difference between working and retirement. Since those optional activities have now been absent for a while, I’ve started thinking of myself as “semi-retired.”
I don’t want to be done yet, though. I feel I have at least one more act left.
First things first: write this post. Since I haven’t blogged in what seems like ages, it took a herculean effort to do basics like login to WordPress, get into my blog folder, search the title index for links, remember what to do with tags, etc. These tasks are automatic when I’m doing them multiple times per week but after four months away, a chisel is needed for newfound rust.
I can now be the last, probably, to say Happy New Year to everyone! Greetings after a long hiatus.
My plan going forward, first and foremost, is to catch up on the blog. This will involve many of the things I wish to revisit: restarting the stock study engine, backtesting option strategies, catching up on financial journals, and studying other investment ideas from my reading or personal trading. Perhaps I’ll also process some of what I have learned from the BetterInvesting volunteer program.
Today’s goal was just to get this post done—whether adequately proofread or not—thereby getting me off the schneid. Tomorrow I’ll need to follow-through but for the time being, mission accomplished!
Categories: About Me | Comments (1) | PermalinkInvesting in T-bills (Part 13)
Posted by Mark on March 11, 2024 at 11:25 | Last modified: April 6, 2024 09:52Last time, I discussed how I invest in zero-coupon T-bills and presented a sample calculation of annual yield. For educational purposes, I will begin today’s post with a similar calculation for a T-bill with coupon.
I have previously invested in couponed T-bills but will no longer be doing so. I recently spoke with a fixed-income representative at my brokerage who told me YTM is calculated a bit differently and for more complexity because coupon payment(s) and accrued interest need to be factored in, the payout ends up being slightly less for numerous couponed T-bills versus zero-coupon T-bills she has compared.
As a sample calculation, consider a T-bill purchased for $99.079 (10X multiplier applies) on Mar 19, 2024, to mature on Aug 31, 2024 (165 days). This was stated to have a 5.357% YTM with $1.766 accrued interest (first coupon Feb 28, 2023) and 3.25% coupon. The 3.25% coupon is semi-annual with each coupon payment half that amount. This bond, therefore, issued coupon payments on Feb 28 and Aug 28, 2023 (or the first business day thereafter if on a weekend), along with Feb 28, 2024. Accrued interest—which gets subtracted since owed to previous bond owner—is from the latter date, and a final coupon payment (Aug 28, 2024) will be issued at [first business day after if on a weekend] maturity:
100% * ((1000.00 – (99.079 * 10)) + (1000 * (3.25 / 100 / 2)) – 1.766) / (1000 * (165 / 365)) = 5.241%
As with the zero-coupon T-bill calculation, this is not an exact match (to 5.357%) but in the ballpark. As a partial explanation, the fixed-income representative told me something about the YTM calculation for couponed T-bills not accounting for accrued interest that must be repaid and is not actually part of the calculation.
I always maintain a cash buffer when investing in T-bills. I hinted at this in the second-to-last paragraph of Part 4 as well as Part 12 where I mention the 90% number. If the market moves against me and a short option need to be bought back for a loss, then my cash balance will go down. If I am consistently buying long options that don’t pay out then cash balance can be depleted as well. As stated in the third paragraphs of Part 2 and Part 3, the last thing I want is for my cash balance to go negative and be forced to borrow brokerage funds because the margin interest rate is over double what I receive on T-bills.
Were I primarily investing in long stock, a cash buffer would be less important. Losing $5,000 on a $20,000 stock position would likely be followed with investment of the remaining $15,000 in a different stock; only if I turned around and invested another $20,000 would I deplete the cash balance. Besides, as mentioned in the fourth paragraph of Part 2, a [predominantly] stock investor will use most free cash for equity investments thereby leaving little left over for T-bills anyway.
I will continue next time.
Categories: Financial Literacy | Comments (0) | PermalinkInvesting in T-bills (Part 12)
Posted by Mark on March 7, 2024 at 08:43 | Last modified: April 6, 2024 09:13As mentioned in the fifth-to-last paragraph of Part 8, if trading options with a lot of free cash in the account then one really must invest that cash in T-bills (or some comparable bond position).
My goal with T-bill investment is to earn a relatively high interest rate as discussed in the second paragraph of Part 2. I do not claim this to be optimized or any sort of “best” approach. It makes sense to me, it fits my risk tolerance, and it accomplishes the goal pretty well. The process is a mechanical one that—as mentioned in the fourth paragraph of Part 2—does require a minimal time commitment (usually up to 10 minutes per week).
See Part 1 for a refresher on T-bills.
I allocate about 90% of my free cash to a bond ladder with 6-10 tranches. Every Tuesday, I use my brokerage platform (secondary market) to filter for Treasurys up to one year to maturity, to sort by yield-to-maturity (YTM), and to find highest YTM with shortest maturity date. I generally target maturities 6-10 weeks out and see YTM proportional to [weeks to] maturity. If I see a higher yield for a much shorter maturity date, then I pounce (it may not be the good deal it seems; I don’t yet know what mitigating factors play into this phenomenon). This may result in multiple tranches maturing on the same day that I can later smooth out by purchasing two tranches maturing one week apart on the same day.
Once I have a CUSIP number for the desired T-bill, I call the brokerage to place the order. Prices quoted over the phone are sometimes [slightly] lower, which means a higher YTM. No additional fee is assessed for placing the order by phone and when I call earlier in the day, I usually get connected within 2-3 minutes.
I present one example of a recently-purchased T-bill for those who may want to do the same to ensure accuracy or investment understanding. On Feb 27, 2024, I purchased a T-bill for $99.202 maturing on Apr 23, 2024, and paying 5.355% YTM. Yield is an annualized number that requires division by fractional holding period (in this case 56 days). Also, a 10X price multiplier is always involved. The calculation is:
100% * (1000.00 – (99.202 * 10)) / (1000 * (56 / 365)) = 5.201%
This is not an exact match but in the ballpark. A fixed-income representative recently told me T-bill YTM calculations factor in TVM. I don’t know exactly how the fudge factor works, but approximate is all I need (and far better than 0.35% or 0.57%).
I will illustrate a T-bill with coupon next time.
Categories: Financial Literacy | Comments (0) | Permalink