Naked Put Study 2 (Part 4)
Posted by Mark on November 15, 2016 at 06:55 | Last modified: August 26, 2016 09:52Having completed an initial comparison between naked puts and long stock, I now begin the process of trying to determine how I might be able to improve this system.
I will start by looking to the equity curve itself as an indicator to exit. I had always loved this idea until I read Kevin Davey’s article in Futures magazine, which suggests it may not be the magic bullet after all.
I begin by determining how many times the equity curve crosses its moving average (MA). Significant drawdowns (DD) on the naked puts (NP) performance graph only happen a handful of times. I would imagine excessive triggers will likely cause whipsaw losses. Let’s see how this plays out:
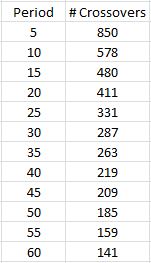
As expected, the number of crossovers decreases as the period gets longer. Even at 60 days, however, the indicator generates 141 crossovers. Only nine major DDs are evident in the performance graph: Sep 2001, summer 2002, fall 2008, Feb-Mar 2009, May 2010, Jul-Sep 2011, fall 2014, Aug 2015, and Jan 2016. Even if I relax my criterion and aim to filter out some smaller DDs, I still see fewer than 20. But 141…!
The next step is to determine the total gain/loss as a result of the equity MA filter. I used Excel to score each trading day as 1 or 0 depending on whether equity was above or below its MA, respectively. When equity crossed above its MA, I calculated a difference to determine whether the filter saved or cost me money by being out of the market during the previous dip. I totaled all gains and losses from the equity MA filter and also represented this as a percentage of the total $61,479,063 gained throughout the NP backtest. Here are the results:
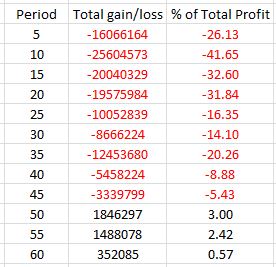
The red numbers are losers and some of these cannibalize significant profit. Keep in mind that aside from total profit, max DD is the rest of the story. So if the filter were to decrease total profit by 40% and max DD by 50% then I could still trade the system with twice the size and post a larger net profit while maintaining constant max DD.
It seems like the 55-day period might be a sweet spot but I’d like to study longer periods to be sure.
I will continue next time.
Categories: Backtesting | Comments (1) | Permalink