2021 Performance Review (Part 2)
Posted by Mark on March 29, 2022 at 06:47 | Last modified: February 8, 2022 11:23Last time, I began to lay the groundwork for a long-term performance review. Today I will continue the discussion.
My hopes for doing this in Python resulted in the project dragging on for a couple extra weeks until I finally decided to stick with my original Excel spreadsheet, which had data from 2001 – 2016. The first thing for me to do was to complete this through 2021. The first few months of the spreadsheet looks like this:
![]()
Eventually, I started adding the last Friday dates for the beginning and end of the monthly periods to make lookup quicker.
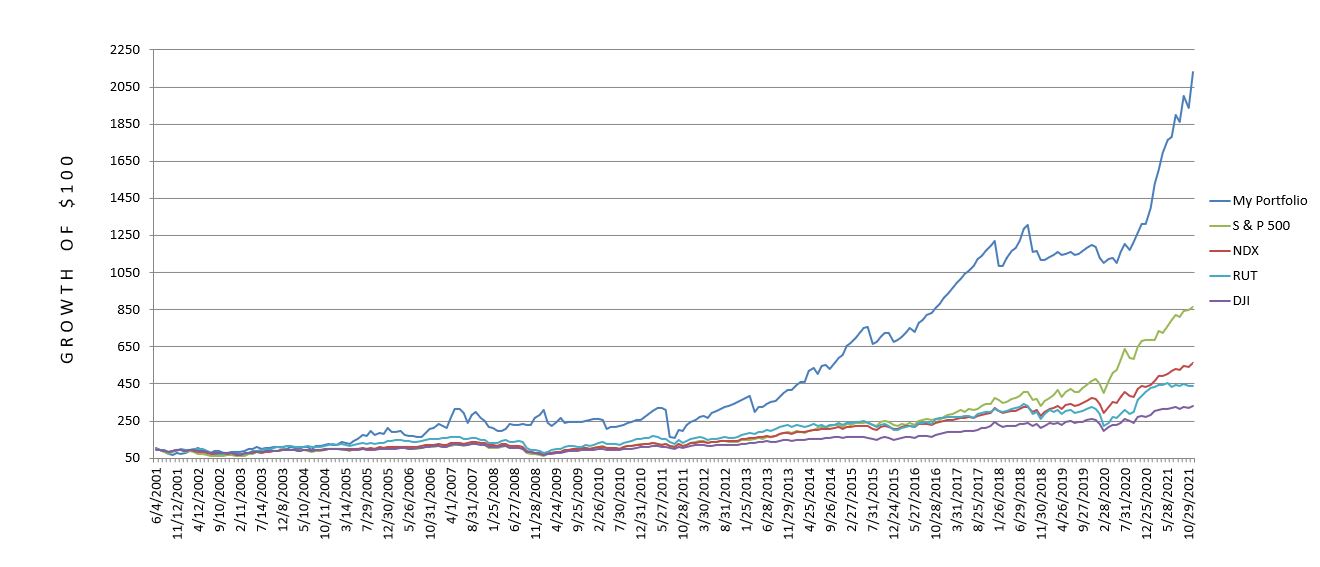
After entering the monthly performance of my portfolio through 2021, I calculated monthly performance for SPX, RUT, NDX, and DJI. As the spot indices do not include dividends, I fetched historical dividend yield data from http://www.multpl.com/s-p-500-dividend-yield/table for SPX and https://www.macrotrends.net for the other three. On the latter website, IWM and QQQ yields are provided quarterly and DIA yields monthly. For each data series, I took the highest value for all four quarters (or 12 months) and used that as the dividend yield for the entire year.
As a result of this conservative manipulation, the benchmark return is slightly enhanced and my comparative trading performance will be weaker. I prefer to err on the side of conservativism (see sixth paragraph here and last full paragraph here) just in case I’m ever caught wearing the rose-colored glasses without my notice (e.g. sixth paragraph here).
I also seize the opportunity for conservatism in my handling of missing QQQ yield data. No data are available prior to 2006. I therefore plugged in the highest quarterly yield recorded from 2006-2021 for 2001-2005. The gist of all this is to weaken my results when reasonable to do so. If I still come out shining bright then it may be a significant finding. I feel the same way about backtesting performance: bias against backtesting results in every way possible such that if the results still pass muster, I may indeed be looking at a viable trading candidate.
I have discussed critical analysis many times (e.g. third-to-last paragraph here). To believe something is worthwhile in this industry, performance results should be impressive beyond a reasonable doubt. Make sure to include the headwinds because you can be sure Mr. Market won’t forget them (see fifth-to-last paragraph here) at the hard right edge of the chart.
Here’s a first look at the performance comparison:
I will continue next time.