Practice Trades Cal 1.11A
Posted by Mark on February 24, 2022 at 07:13 | Last modified: December 24, 2021 12:34Look back at the previous two practice trades (guidelines here unless otherwise stated). Both start out with negative skew, but Cal 1.10A requires a bullish bias (-0.65 delta) to profit. To be fair, I should also look at Cal 1.11 with a bullish bias.
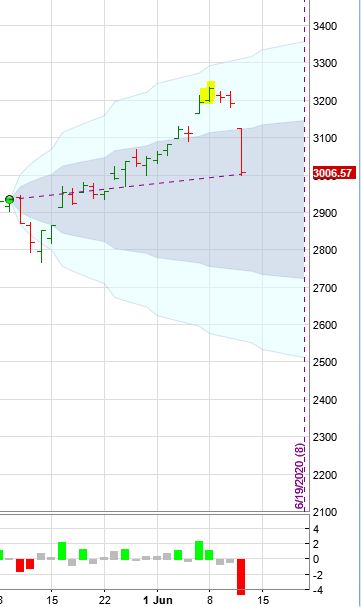
Cal 1.11A begins 5/11/20 (67 DTE) with SPX 2934 and 3060 puts -$168 (-2.6%). MR is $6,418 (two contracts), TD 2, IV 22.0%, horizontal skew -0.2%, NPD 8.8, and NPV 262.
With TD starting at 2, a different management plan may be advised as trade begins very close to an adjustment point. ML may also need tweaking since it can arrive sooner with directional bias. I haven’t been monitoring data on this (and don’t intend to), but the ONE model currently shows T+0 100 points above downside ML and only 20 points from downside expiration breakeven (BE). I would guess these numbers to be less than a NTM time spread with TD starting much higher.
Whatever management thresholds I choose, no right answer(s) may exist because any will have its pros and cons. Even more difficult is determining something consistent between historical backtesting and future live trades.
Getting back to the current Cal 1.11A, MDD is -$1,188 (-18.5%) on 2 DIT: just a stone’s throw away from ML. This is a case in point, although the quick loss does come on the heels of back-to-back 1+ SD down days: a rarity.
Exit trade 52 DTE for profit of $802 (12.5%). SPX up 0.42 SD with IV up 5.9% over the 15 days. Horizontal skew has decreased to -1.2%, which is not good for getting into the trade but can be very good while in the trade. TD = 5 at PT.
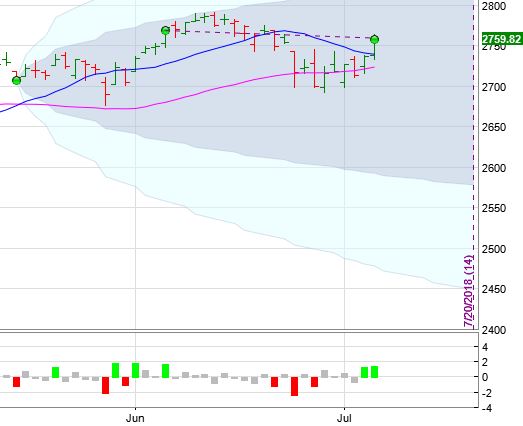
A study of MFE would be interesting to determine whether any sort of PT is optimal. 1.11A goes on to gain $1,662 (25.9%) at 43 DTE before slipping back to +$642 (10%) with TD 5 the next trading day after that. PnL dips the next trading day (39 DTE) to 7.7% (TD 5) before soaring to +45.7% three trading days later at 36 DTE on a 4.6 SD downmove (see price chart here).
I would be interested to collect MFE data in a Python program (as mentioned in the third paragraph here).
Bottom line for today: like Cal 1.10, a bullish bias in this negatively skewed Cal 1.11 ends up profitable as well.
Categories: Option Trading | Comments (0) | PermalinkPractice Trades Cal 1.10 – 1.11
Posted by Mark on February 22, 2022 at 07:28 | Last modified: December 24, 2021 09:15Cal 1.10 (guidelines here) begins 5/4/20 (74 DTE) with SPX 2838 and 2840 puts -$168 (-2.4%). MR is $7,128 (two contracts), TD 29, IV 31.4%, horizontal skew -0.02%, NPD 1.4, and NPV 216.
MDD is -$1,048 (-14.7%) on 44 DTE.
Exit trade 42 DTE for loss of $2,158 (-30.3%). SPX up 1.3 SD to 3190 with IV down 40% over the 32 days. Horizontal skew up to +0.6%. This trade exits on that same big up day as Cal 1.9 with a 2.2 SD one-day rally.
Anecdotally speaking (since I’ve only backtraded 10 so far), the last two calendars have not had the snap seen in some earlier ones. With the high IV “juice” and/or [significant] positive skew, perhaps it’s not unusual for calendars to reach PT in sudden, unexpected fashion. In contrast, this trade (and the second half of Cal 1.9) faces a market steadily grinding higher.
What if I placed Cal 1.10 at -0.65 delta rather than the first 10-point strike above the money?
Cal 1.10A begins 5/4/20 (74 DTE) with SPX 2838 and 3000 puts (roughly -0.65 delta) -$168 (-2.4%). MR is $6,578 (two contracts), TD 3 (expectedly lower being farther ITM), IV 31.4%, horizontal skew -0.6%, NPD 7.7, and NPV 241.
MDD is -$448 (-6.8%) on 65 DTE.
Exit trade 56 DTE for profit of $742 (11.3%). SPX up 0.58 SD with IV down 24% over the 18 days. Horizontal skew has decreased to -1.0%, which is not good for getting into the trade but can be very good while in the trade.
In this instance, leaning bullish rewrites history. Whether this accurately reflects a larger sample size remains to be seen.
Cal 1.11 begins 5/11/20 (67 DTE) with SPX 2934 and 2940 puts -$168 (-2.4%). MR is $7,128 (two contracts), TD 19, IV 22.0%, horizontal skew -0.9%, NPD 1.6, and NPV 233.
MDD is -$1,378 (-19.3%) on 39 DTE: just a slight breeze shy of ML.
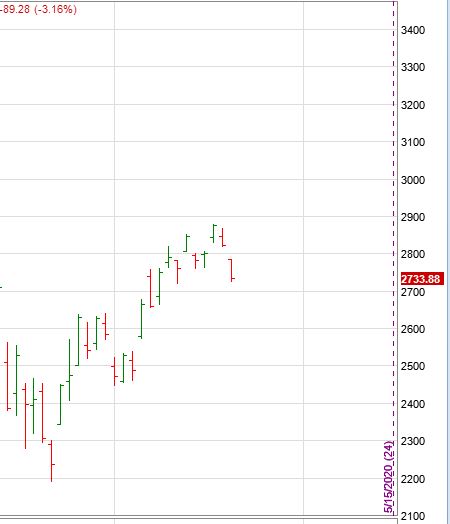
Exit trade 36 DTE for profit of $2,282 (32.0%). SPX up 0.38 SD with IV up 80% over the 31 days. Horizontal skew has increased to +1.3%. The underlying price action behind this trade is as follows:
The gradual, grinding-higher market resulted in two consecutive losers. This is almost the third. MDD occurs on the highlighted bar, which is just three days before a 4+ SD downmove carries home the W. The highlighted bar presses the market well into the second SD of the probability cone: an extreme I suspect usually does not persist [but most certainly can].
Trading’s version of Bruce Willis (apologies in advance) is mean reversion with a vengeance.
Categories: Option Trading | Comments (0) | PermalinkPractice Trades Cal 1.7 – 1.9
Posted by Mark on February 18, 2022 at 07:27 | Last modified: December 22, 2021 11:23Cal 1.7 (guidelines here) begins 4/13/20 (67 DTE) with SPX 2762 and 2770 puts -$168 (-2.9%). MR is $5,738 (two contracts), TD 34, IV 37.1%, horizontal skew +0.7%, NPD 1.3, and NPV 178.
On 66 DTE, MDD hit with trade -$308 (-5.4%).
Exit trade 59 DTE for profit of $692 (12.1%). SPX down 0.18 SD with IV up 11% over the eight days. Horizontal skew has increased to +0.9%.
Cal 1.8 begins 4/20/20 (60 DTE) with SPX 2828 and 2830 puts -$168 (-2.7%). MR is $6,288 (two contracts), TD 45, IV 37.3%, horizontal skew +0.8%, NPD 1.2, and NPV 191.
Exit trade 43 DTE for profit of $632 (10.1%). SPX up 0.23 SD with IV down 29% over the 17 days. Horizontal skew has decreased to -0.1%.
Cal 1.9 begins 4/27/20 (81 DTE) with SPX 2882 and 2890 puts -$168 (-2.4%). MR is $6,978 (two contracts), TD 21, IV 27.6%, horizontal skew -0.4%, NPD 1.5, and NPV 211.
MDD (before exit) is -$388 (-5.6%) on 44 DTE.
Exit trade 42 DTE for loss of $1,528 (-21.9%). SPX up 1.2 SD to 3190 with IV down 31% over the 39 days. Horizontal skew up to +0.4%. SPX rallying 2.2 SD on the last trading day was the coup de grâce:

This trade would fare better were it placed more bullish. Horizontal skew < 0 at trade inception. Both of these statements strike me as "usual." We will find most calendars to begin with negative skew. Stocks traditionally move up more often than down. Whether negative horizontal skew can be used as an indicator in this way will require a larger sample to determine.
Categories: Option Trading | Comments (0) | PermalinkPractice Trades Cal 1.3 – 1.6
Posted by Mark on February 15, 2022 at 07:33 | Last modified: December 21, 2021 11:01The following four practice trades are backtested over the following market price action:
Conventional wisdom would label this a bad time to place time spreads with IV so high. How do you think things will turn out?
Cal 1.3 (guidelines here) begins 3/16/20 (60 DTE) with SPX 2409 and 2410 puts -$168 (-2.3%). MR is $7,268 (two contracts), TD 85, IV 78.5%, horizontal skew +7.2%, NPD 1.5, and NPV 196. Some of these numbers are staggering: IV, horizontal skew, and MR (probably due to the options being packed with so much extrinsic value).
MDD is the very next day with SPX up 1.35 SD, IV 70%, and trade -$178 (-2.5%).
One day later at 58 DTE, exit trade for profit of $1,472 (20.3%). SPX down 0.19 SD with IV down 5% over the two days. Horizontal skew has decreased to +5.3%, which has certainly contributed to the end result.
Cal 1.4 begins 3/23/20 (88 DTE) with SPX 2254 and trade -$168 (-3.5%). Only 25-point strikes are available in the back month, which does not fit the guidelines. I will therefore add the additional guideline to buy back month at the first strike OTM if same strike unavailable. MR is $4,828 (two contracts), TD 17, IV 60.9%, horizontal skew +2.2%, NPD 2.4, and NPV 126.
On 85 DTE, trade -$788 (-16.3%) with SPX at 2632.
Exit trade at 79 DTE for profit of $642 (13.3%). Over 9 days, SPX up 1.02 SD with IV down 8%. Horizontal skew has increased to +2.8%. TD 146 suggests market could move around quite a bit before hitting adjustment point.
Cal 1.5 begins 3/30/20 (81 DTE) with SPX 2629 and trade -$168 (-4.3%). MR is $3,948 (two contracts), TD 62, IV 52.8%, horizontal skew +2.5%, NPD 0.8, and NPV 156.
Exit trade at 76 DIT for profit of $532 (13.5%). Over 3 days, SPX down 0.83 SD with IV down 11%. Horizontal skew has decreased to +1.4%. TD 13.
Cal 1.6 begins 4/6/20 (74 DTE) with SPX 2671 and trade -$168 (-3.2%). MR is $5,208 (two contracts), TD 31, IV 38.6%, horizontal skew +0.7%, NPD 1.2, and NPV 165.
MDD is hit next trading day at -$308 (-5.9%) with SPX nearly unchanged at 2672.
Exit trade at 59 DTE for profit of $1,182 (22.7%). Over 15 days, SPX up 0.30 SD with IV up 7%. Horizontal skew has increased to 1.3%. TD 362.
Horizontal skew can be confusing. Based on numbers alone, I would ideally like to buy it positive. Once in the trade, I want horizontal skew to decrease, which means the long leg remains expensive relative to the short leg.
Categories: Option Trading | Comments (0) | PermalinkPractice Trades Cal 1.2
Posted by Mark on February 10, 2022 at 07:30 | Last modified: December 21, 2021 09:33Building off this practice trade, let’s be random and backtest one year earlier.
Cal 1.2 begins 5/15/17 (67 DTE) with SPX 2403 and 2410 puts -$168 (-6.4%). MR is $2,618 (two contracts), TD 2, IV 7.03, horizontal skew -1.01%, NPD 2.1, and NPV 157.2.
I’m not sure why TD is so low:
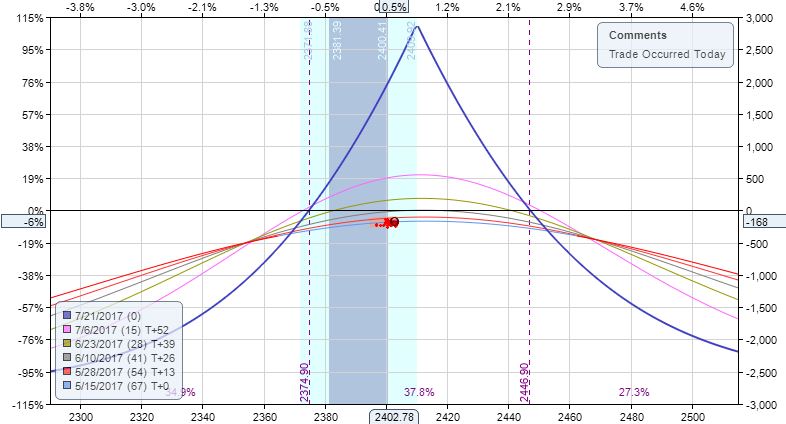
With the calendar less than 10 points above the money, positioning seems fine and I would expect TD to be higher. I’ll keep an eye on this as I look at more example trades.
At 65 DTE, the market is down 3.94 SD to 2358 and trade -$288 (-11%) with TD near zero. Adjustment increases MR to $2,811 and puts trade down 13.2%. TD ~ 1.25 is not very encouraging. Horizontal skew is unchanged.
By 58 DTE, market has completely recovered to 2405 with trade -$442 (-15.7%) and TD = 1 again. Adjustment increases MR to $3,144 and puts trade down $526 (-16.7%). TD 8 is nice, but we’re getting close to ML. Also 4/5 T+x lines are underwater, which means the market will have to trade sideways for a while in order to see profits.
Under current guidelines, I should realize the loss right here.
If not, then I would exit trade by 50 DTE for a loss of $631 (-20.1%).
One thing I find encouraging about this strategy is the limited loss resulting from outsized moves lower. The long vega should hedge provided horizontal skew is unchanged (as it is here). At 65 DTE with the huge move lower, this trade is only -11% after being -5.3% the previous day:
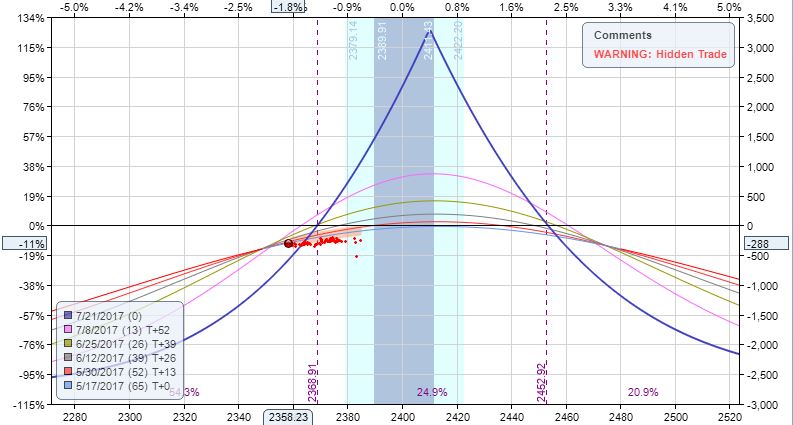
A 4 SD downmove makes this anything but usual. I could exit for a loss immediately. Alternatively, I could just wait (SOH) and see if the market settles over the next couple of days.
SOH would outperform in this particular case. After the market recovers, an upside adjustment is needed at 49 DTE with trade down $422 (14.8%) and MR increasing to $2,846.
Trade -$542 (-19%) on 32 DTE with TD 2. From here, despite some bigger moves up and down, the trade does recover to +$5 at 8 DTE. I don’t have a time stop but I probably should—no later than 9 DTE to be safe? Alternatively, given what I’ve been through on this trade maybe I lower PT to zero and be happy with that.
The very next day, trade -$54 as TD = 1. This would be an adjustment point, but if guidelines dictate exit by 7 DTE anyway, I should close here and book the small loss (-1.9%).
Lots of discretionary ideas here fall under the “art of trading” umbrella. I certainly want to see how the existing guidelines perform over a large sample size of examples before implementing any of them.
Categories: Option Trading | Comments (0) | PermalinkPractice Trades Cal 1.1
Posted by Mark on February 7, 2022 at 07:22 | Last modified: December 22, 2021 15:24I’m going to apply my initial backtesting guidelines shown here with a few tweaks:
- Use 10-point strikes only and lean bullish (by < 10 points) as needed.
- Adjust only when TD shrinks to 1 or less.
- Profit target (PT) 10% and max loss (ML) -20%.
- No time stop.
Cal 1.1 begins 5/15/18 (66 DTE) with SPX = 2707.45 and 2710 puts down $168. MR is $2,778 (two contracts), TD = 11, IV 11.2, horizontal skew -0.44%, NPD = 0.9, and NPV = 177.3.
On 44 DTE, trade down $218 (7.9%) with TD = 1 with market up 0.83 SD over 22 DIT.
Adjustment increases margin requirement (MR) to $3,066 and puts trade down $302 (9.9%). TD increases to 3. Raising second strike any higher results in horrific sag in the expiration curve. Two of five T+x lines are profitable now.
On 42 DTE, trade down $347 (11.3%) with TD = 3.
Exit trade at 14 DTE (52 DIT) for 11.7% ROI ($358). Here is underlying price action during this trade:
Nothing to see here.
Categories: Option Trading | Comments (0) | PermalinkPractice Trades IC 1.2 – 1.6
Posted by Mark on February 4, 2022 at 07:16 | Last modified: December 14, 2021 15:28More of the same, today: backtested trades per guidelines discussed here. All I’m trying to do is build muscle memory.
IC 1.2 begins 1/11/21 (67 DTE) down $336. MR is $18,136 (two contracts), PT is $1,864 * 0.8 = $1,492, and ML = $2,984. At trade inception, TD = 32, IV 17.7, NPD = -1.1, and NPV = -234.7.
MDD = -$596 (-3%) at 51 DTE.
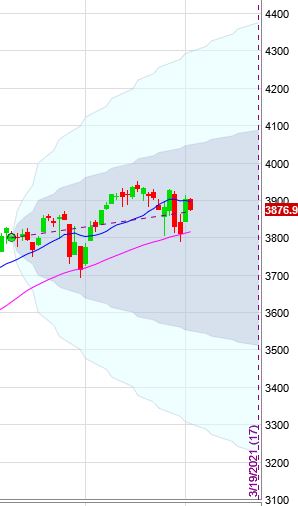
On 3/2/21 (50 DIT), exit trade for 8.7% ROI ($1,569 profit) with market up 0.31 SD. IV increased 7.6% while in the trade. Not much going on here:
Let’s shift the start date one week (actually eight days because of MLK holiday) later to 1/19/21, which is 87 DTE. Again, trade starts down $336. MR is $17,876 (two contracts), PT is $2,124 * 0.8 = $1,700, and ML = $3,400. TD = 23, IV = 17.6, NPD = -1.2, and NPV = -263.9.
MDD = -$1,196 (-6.7%) at 79 DTE.
On 3/22/21 (62 DIT, 25 DTE), exit trade for 9.5% ROI ($1,704 profit) with market up 0.51 SD. IV decreased 21% while in the trade. Once again, not much drama here.
Let’s shift the start date six days later to 1/25/21 (81 DTE). Again, trade starts down $336. MR is $17,846 (two contracts), PT is $2,154 * 0.8 = $1,724, and ML = $3,448. TD = 23, IV = 16.8, NPD = -1.3, and NPV = -259.1.
MDD = -$1,096 (-6.1%) at 79 DTE.
On 3/22/21 (52 DIT, 29 DTE), exit trade for 9.7% ROI ($1,739 profit) with market up 0.25 SD. IV decreased 21% while in the trade. Not much to see here.
Let’s shift the start date two weeks later to 2/8/21 (67 DTE). Again, trade starts down $336. MR is $18,016 (two contracts), PT is $1,984 * 0.8 = $1,588, and ML = $3,176. TD = 25, IV = 12.6, NPD = -1.4, and NPV = -265.7.
MDD = -$346 (-1.9%) at 66 DTE.
On 3/22/21 (42 DIT, 25 DTE), exit trade for 9.5% ROI ($1,704 profit) with market up 0.18 SD. IV increased ~10% while in the trade. Again, not much to see here:

The market sold off a bit then recovered—all for net sideways trading, pretty much.
For my final example of the day (IC 1.6), let’s shift the start date three weeks later to 2/28/21 (67 DTE). Again, trade starts down $336. MR is $18,146 (two contracts), PT is $1,954 * 0.8 = $1,484, and ML = $2,968. TD = 41, IV = 17.7, NPD = -0.7, and NPV = -241.4.
MDD = -$746 (-1.9%) at 78 DTE.
On 5/12/21 (72 DIT, 9 DTE), exit trade for 8.9% ROI ($1,609 profit) with market up 0.5 SD. IV increased ~42% while in the trade. Interestingly, trade exit occurred on a 2.5-SD down day. Three trading days earlier, the position looked somewhat precarious with the market up 1.1 SD over the first 62 DIT:
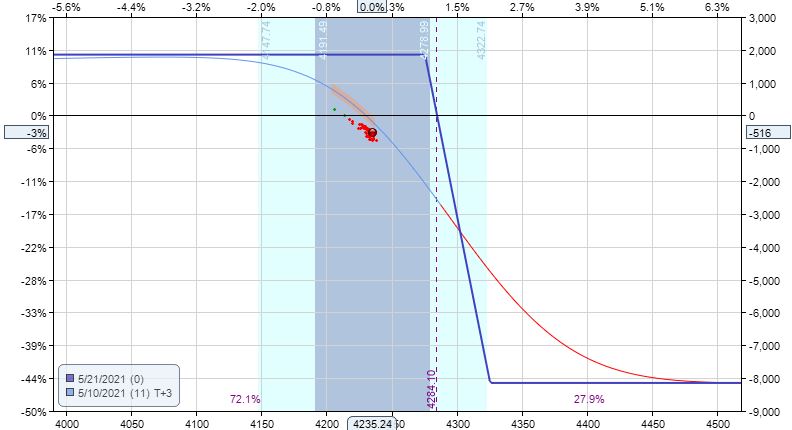
PnL was only -$516 at this point, but TD = 3 and T+0 upside slope is scary. Also note the blue shaded region, which corresponds to a 1 SD move over the next three days. Such a move would put the trade down over $2,000 (although it may be exaggerated if ONE computes this as a 3-day SD due to the weekend when it actually represents a single trading day).
If numbers work out over a large sample size, though, then I would deem such temporary pain to be worth the effort.
Categories: Option Trading | Comments (0) | PermalinkPractice Trades BWB+Cal 1.3 (Part 2)
Posted by Mark on February 1, 2022 at 06:58 | Last modified: December 13, 2021 17:50Today, I want to finish reviewing the backtrade discussed last time.
Were I to take the [farther OTM] prescribed adjustment at 11 DTE (fourth paragraph here):
Loss here is $960 here on consequent margin requirement (MR) of $15,735 (-6.1%).
Second adjustment point is hit with 7 DTE and trade down $1,285 (8.2%):
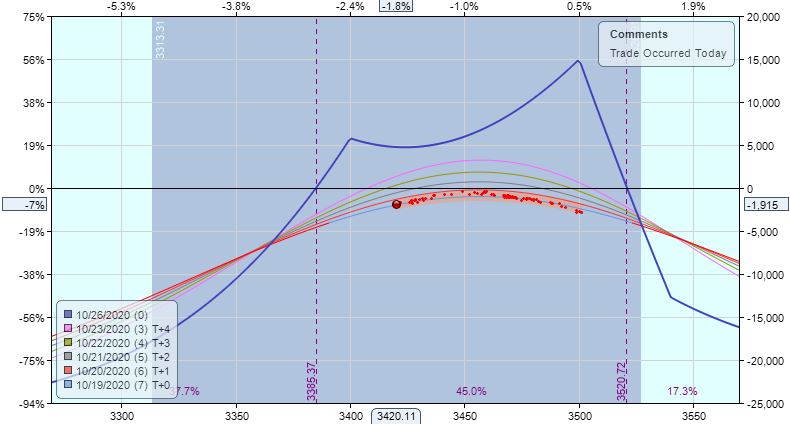
This puts me down $1,915, which is 7.2% of consequent MR $26,570. The T+x lines are more positive than negative, which is good. This is a somewhat directional trade with NPD 53, but TD is a robust 12.
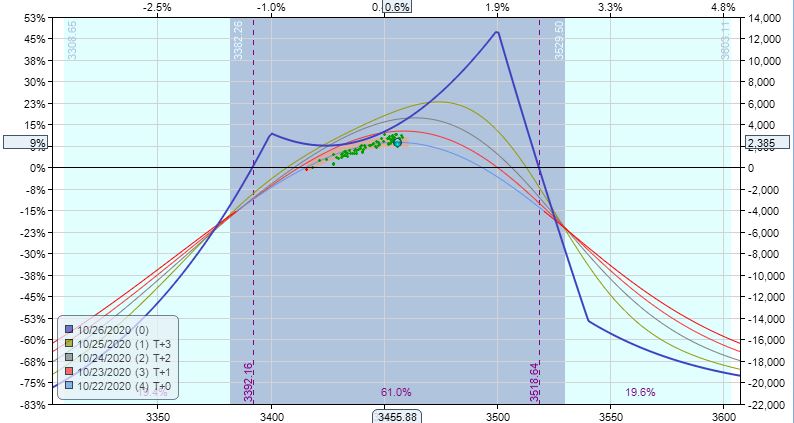
I become profitable (+$209) the very next trading day.
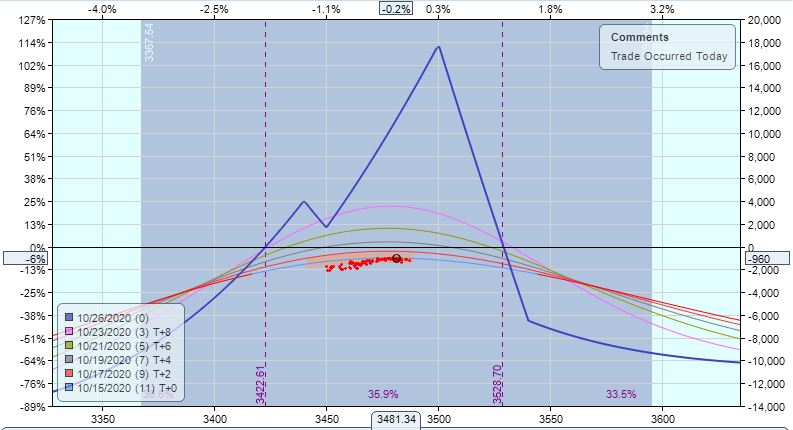
Two days later at 4 DTE, I hit the profit target up $2,385 (+9%):
Whether done “right” or “wrong,” this seems like a challenging trade because of the need to stare big unrealized losses in the face (-$2,920 by ignoring first adjustment point and -$1,915 by following guidelines). The only way to avoid these big losses would be to monitor adjustment points continuously, which violates the once-daily monitoring concept of the strategy.
The losses may not be extraordinarily large on a percentage basis if I position size for a potential 2-3x capital expansion. I just don’t yet know how the numbers pan out over a large sample size of trades. Those reaching profit target without adjustment will earn 5% of a minimal MR. A % ROI profit target inversely proportional to current MR could make sense.
This is probably an age-old question that pertains to any strategy where adjustment significantly impacts MR.
Categories: Option Trading | Comments (0) | Permalink