Practice Trades BWB+Cal 1.3 (Part 1)
Posted by Mark on January 27, 2022 at 07:02 | Last modified: December 13, 2021 17:00This trade begins 10/12/20 (14 DTE) down $840. MR is $7,140 (five contracts) and PT is $7,140 * 0.05 = $357. At inception, TD = 128, IV 17.9, NPD = -0.65, and NPV = -140.
PnL is -$940 at 1 DIT.
Three trading days later, I hit the first adjustment point with trade down $540 (7.6%):
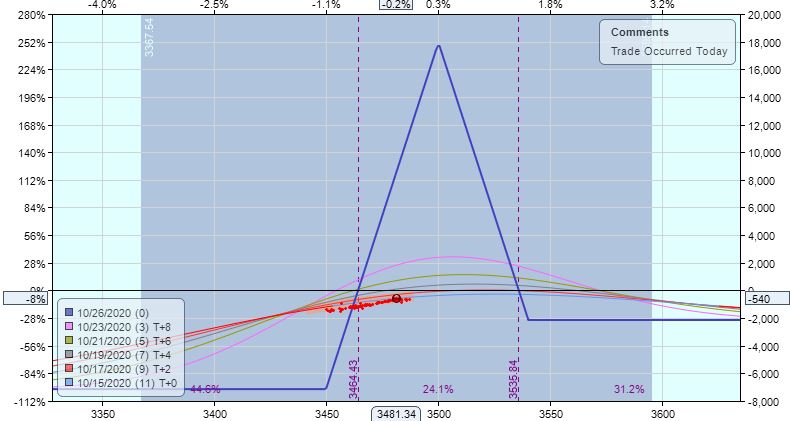
This is 17 points into a 70-point width (between breakevens), which is just inside the 25-yard-line. Adjusting puts the calendar inside the BWB structure, which for some reason doesn’t feel right to me. Other options would be to place farther OTM (40 points) or to do nothing at all. The latter would be vulnerable to a big downside opening gap and/or being far beyond an adjustment point at next monitoring in 24 hours.
Since this isn’t even MDD and TD = 8, I’m going to be a rebel and do nothing at all.
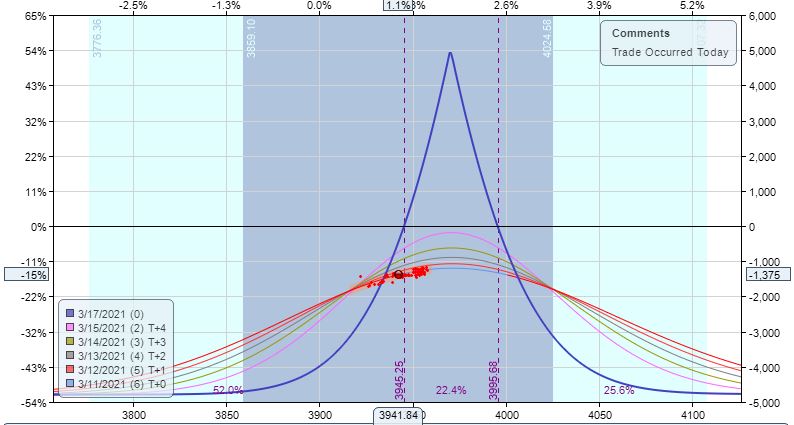
Two trading days later, we get a -1.5 SD move:
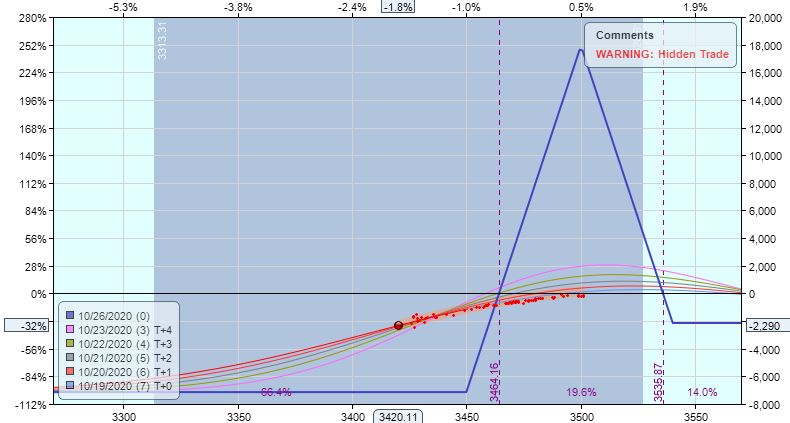
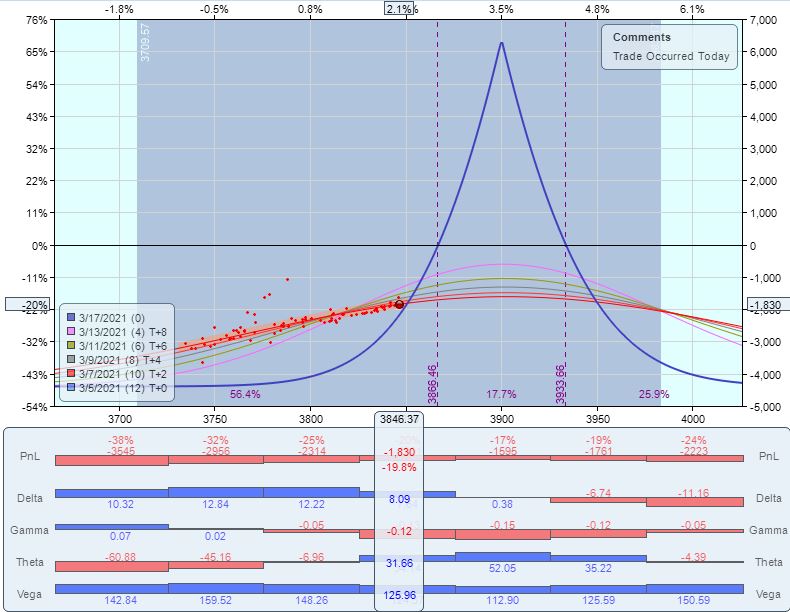
I am now down $2,290 (-32%) and the prescribed adjustment (with lower wing calendarization) looks like this:
Three of five T+x lines are underwater, but facing a big loss I find it difficult to exit. The adjustment increases my loss to $2,920, which is [only] -10.8% of the [dramatically increased] $27,155 resultant margin requirement.
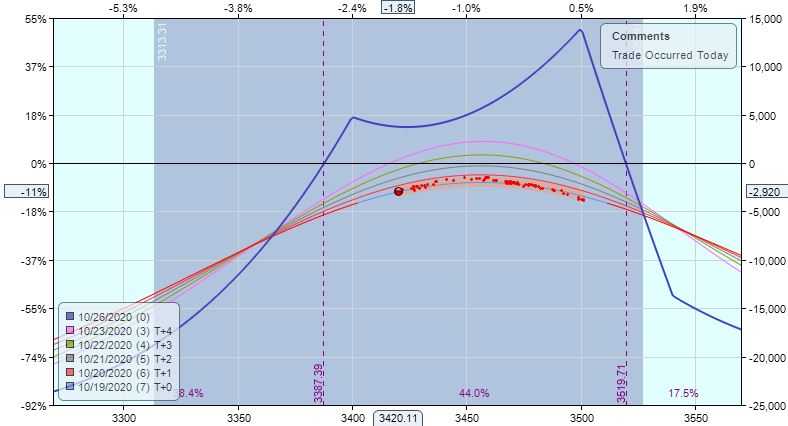
Blue skies lie ahead. Two trading days later I have a $130 profit. One trading day after that, I’m up $1,380 (5.1%). One trading day after that, I’m up $3,267 (12%):
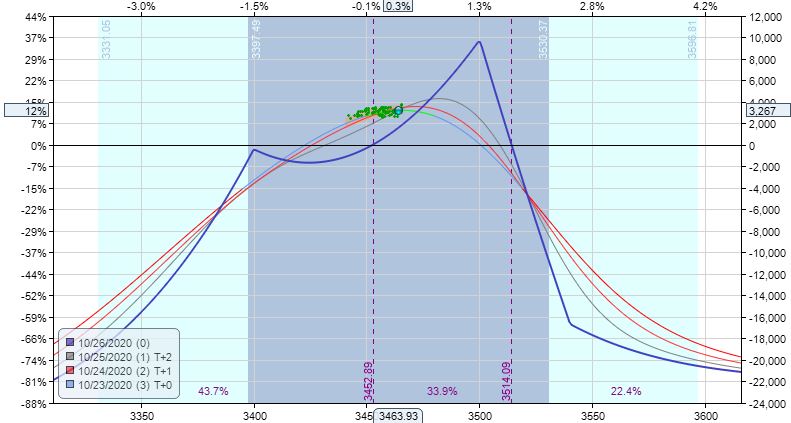
If I didn’t exit for +$1,380, which was at the profit target, then this is certainly a must-exit being Friday and 3 DTE.
Things work out well by doing the trade “wrong.”
What if do the trade “right?” I will pick up here next time.
Categories: Option Trading | Comments (0) | PermalinkPractice Trades BWB+Cal 1.2 (Part 3)
Posted by Mark on January 24, 2022 at 07:41 | Last modified: December 14, 2021 11:07Today I wrap up some ideas for—well, let’s call it what it is: curve fitting!
Backing up, instead of closing BWB + downside calendar and rolling 9 points above the money, I could roll farther above the money akin to the guidelines discussed here:
One day later, the market has gone against me even though the trade is now down a bit less ($1,275):
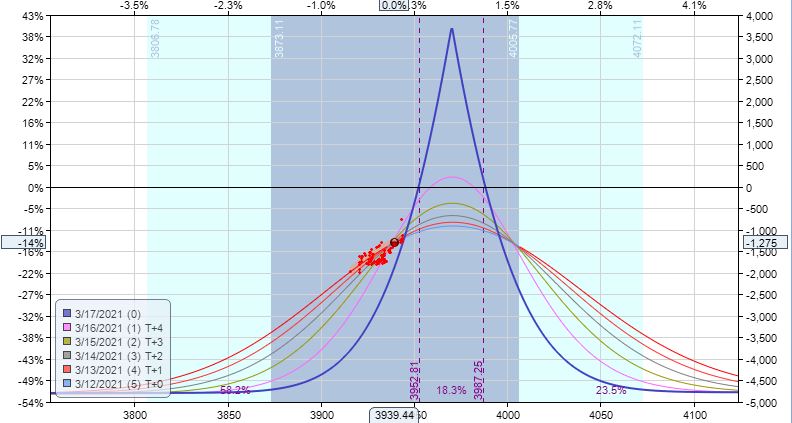
Although the directionality may appear risky, I had the same thing in place one day earlier.
MR is $9,235 here, and this version is profitable one day to expiration with a profit of 1% ($50):
If I were really gutsy and held to expiration, I could end up with the motherlode:
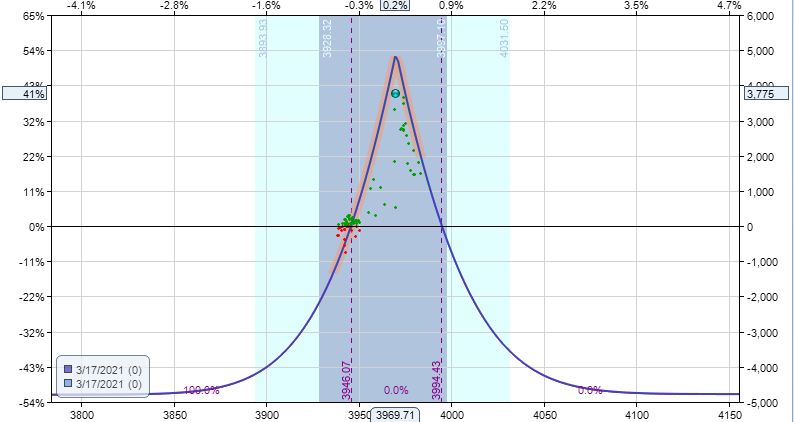
That’s a profit of 41% ($3,775).
Back to reality, though: in the absence of other validated variants, this trade meets unfortunate demise at 2 DIT with a hefty loss of 15.3% ($1,410).
Since each of these variants begin by closing the original BWB and added calendar, they are essentially new trades altogether. By linking them to the previous transactions, I ensure an overall exit for something ranging from small loss to windfall profit. To maintain consistency and repeat the same strategy every week, though, I should keep things separate: BWB + Cal on one hand and, if so desired, bullish calendar on another.
Categories: Option Trading | Comments (0) | PermalinkPractice Trades BWB+Cal 1.2 (Part 2)
Posted by Mark on January 21, 2022 at 07:36 | Last modified: December 12, 2021 13:04Per the suggested guidelines, this trade was a loser. Surely we can always come up with tweaks to improve the outcome.
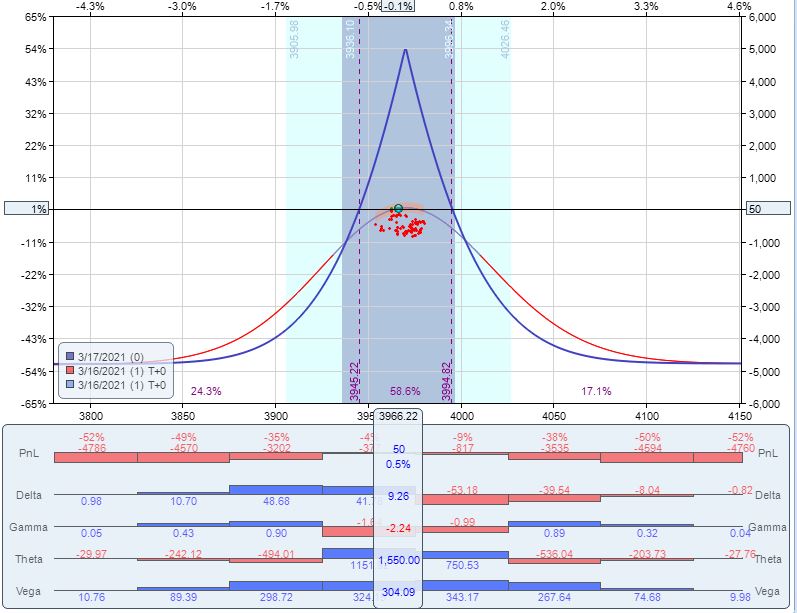
One alternative would be to close current positions and enter a calendar above the money at 2 DIT. This is making a blatant directional bet albeit one that coincides with the general tendency of stocks to go up more often than they go down:
This adjustment would put trade down $1,830 on $9,235 margin with TD = 4. Despite a subsequent down day, we see a nice recovery through 3/11/21:
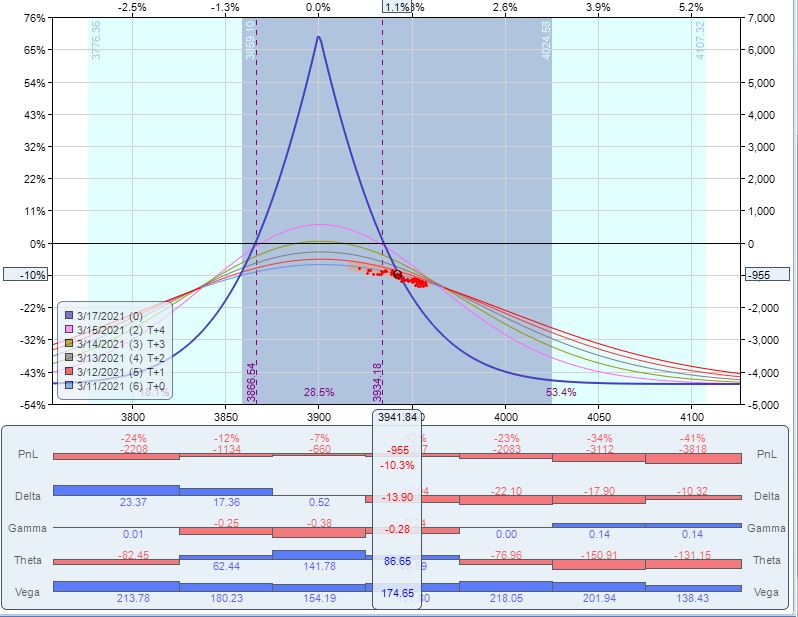
Trade is now completely directional to the downside, which blatantly taunts the general tendency. We could exit for a loss of $955, which is lower than the 2 DIT loss of $1,410.
If we choose to press onward, then we could roll to first above-the-money [10-point] strike. This would take PnL back to -$1,375 since the adjustment involves 20 contracts. Be aware that each adjustment takes days from which to recover (unless I’m being far too aggressive in my TF assumptions).
One day before expiration, this trade is down $375. Given what we’ve been through, we should take this and consider it a huge moral victory.
Rolling the dice to expiration:
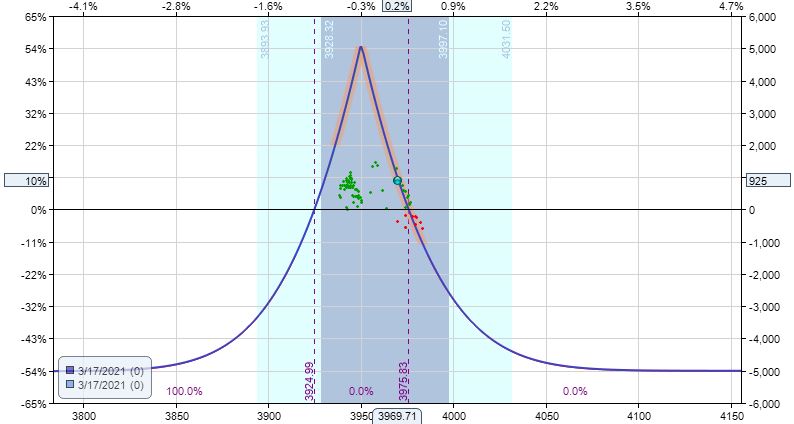
That’s a 10% return of $925. Lucky Charms!
But wait… there’s more?! Watch for it next time.
Categories: Option Trading | Comments (0) | PermalinkPractice Trades BWB+Cal 1.2 (Part 1)
Posted by Mark on January 18, 2022 at 07:32 | Last modified: December 12, 2021 12:55This trade begins 3/3/21 (14 DTE) down $840 (max DD). MR is $6,065 (five contracts) and PT is $6,065 * 0.05 = $304. At inception, TD = 44, IV 21.9, NPD = 1.59, and NPV = -122.
After one day, market is down 1.3 SD to force adjustment. Trade now down $1,360 on margin of $9,235.
On very next day, market is up 1.6 SD to force adjustment with trade down $1,410. Second adjustment looks like this after calendar repositioning and rolling out upper wing:

Since most T+x lines are underwater, I would close the trade for a loss of 15.3%. The problem with T+x lines being underwater is that I would have to wait nearly to expiration to be profitable—and even at that, only if the market remains in a range. The market is 0/2 so far at remaining “within range,” which seems like a very ominous sign.
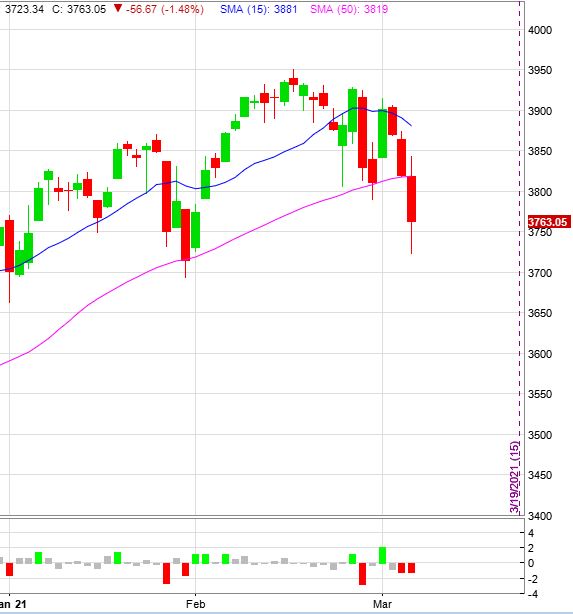
With trade opened near close of first bar, the underlying price chart looks like this:

Recovery from such a whipsaw is difficult in a short-term strategy. I would be fine without the first adjustment, which occurred with the market still under the profit tent. These guidelines dictate adjustment nevertheless.
I will continue next time with some potential alternatives to managing this trade.
Categories: Option Trading | Comments (0) | PermalinkPractice Trades BWB+Cal 1.1
Posted by Mark on January 13, 2022 at 07:00 | Last modified: December 10, 2021 14:28Practice Trades BWB+Cal correspond to the following general guidelines:
- With 14 DTE, buy first above-the-money 40/60 BWB.
- Use 10-point strikes only and TF $21/contract.
- If underlying exceeds upper strike then buy calendar above the money.
- If underlying exceeds upside calendar strike then [close downside Cal if needed and] buy Cal above the money.
- If T+x lines underwater, then calendarize upper leg of BWB to raise (else close).
- If underlying falls below 25-yard line of BWB then [close upside Cal if necessary and] buy Cal below the money.
- If underlying falls below downside calendar strike then roll calendar below the money.
- If T+x lines underwater, then calendarize lower leg of BWB to raise (else close).
- PT 5%
- Monitor position once daily and adjust as needed.
The wings may be adjusted to 30/40, 50/60, 40/50, etc. in order to limit initial NPD, which should ideally be slightly negative. The short strike may also be split although this may make execution more complex.
This trade begins 3/18/21 (14 DTE) down $840 (max DD). MR is $7,015 (five contracts), PT is $7,015 * 0.05 = $351.
At trade inception, TD = 36, IV 17.1, NPD = -1.78, and NPV = -122.
First adjustment occurs very next trading day with max margin increasing to $11,285.
Second adjustment occurs on 3/26/21 (8 DIT) by rolling up calendar and calendarizing two of the five upside wing contracts. This increases margin to $14,238.
On 3/30/21 (2 DIT), exit trade for 7.2% on max margin with market up 0.32 SD in 12 days. IV decreased 18%.
I have two general comments.
First, I suspect $21/contract TF is much more than I should normally see in live trading (this amounts to ~12% initial margin with a PT of 5%, which seems preposterous). If this works out okay in backtesting or on paper, then it should work out well. As I do some of these live, I should get a good feel for what number to expect.
Finally, I’m a bit unclear as to whether I should use PT as a percentage of initial margin, current margin, or max margin. Until I see reason to change, I will use the latter. This does mean, however, that the trade should always be done with a limited portion to account for margin more than doubling upon adjustment.
Categories: Option Trading | Comments (0) | PermalinkPractice Trades: IC 1.1
Posted by Mark on January 10, 2022 at 07:47 | Last modified: December 9, 2021 17:19Whether important or not, I’m not happy about my trade diversity last year. In an attempt to push the envelope and improve, I’m going to start spending more blog time posting practice trades.
A practice trade may be live, paper, or backtested. Live and paper trades are both followed in real-time. Backtested trades are done completely in hindsight.
My goal in doing this is to gain more familiarity. Period. I want to be able to place these trades as if they are second nature. My bread-and-butter strategy has been repeated daily for months. I want to feel equally comfortable with others.
As seen in the post title, I am calling these “Practice Trades.” The subsequent code describes type of trade, trade number of the methodology referenced, and methodology (seen after the dot). I may or may not go into detail about the specific trade plan since my goal is not to wax eloquently about the pros, cons, and potential strategy variants. You’re always welcome to post questions or comments below.
Today, I will include the following methodology:
- Place in SPX monthly cycle 60-90 DTE using 25-point strikes and include TF $21/contract.
- Sell NTM option < delta 12 and purchase 100 (50) points farther OTM for puts (calls).
- Exit at 80% capture, when down 2x that amount, or with 7 DTE: whichever comes first.
- Trade and monitor 15 minutes before regular market close every trading day.
This trade begins 1/4/21 (74 DTE) down $336. MR is $18,036 (two contracts), PT is 1964 * 0.8 = 1572, and ML = 3144.
At trade inception, TD = 46, IV 21.31, NPD = -0.69, and NPV = -239.72.
On 3/4/21 (59 DIT), this trade closed for ROI of 9.1% with market up 0.19 SD. IV increased 17.5% over the following:
Chalk up one for the good guys. Remember though, the focus here is on developing “muscle memory.” To that end, losses must be welcomed as they are a reality of trading.
Categories: Option Trading | Comments (0) | PermalinkDictionary Struggles in Python (Part 2)
Posted by Mark on January 7, 2022 at 07:09 | Last modified: November 10, 2021 10:08Today I want to continue discussion from last time about problems I had coding a dictionary application in Python.
Despite the fix already described, I remained puzzled with regard to speed of the original program. I added some #debug lines for timing purposes and also to display progress:
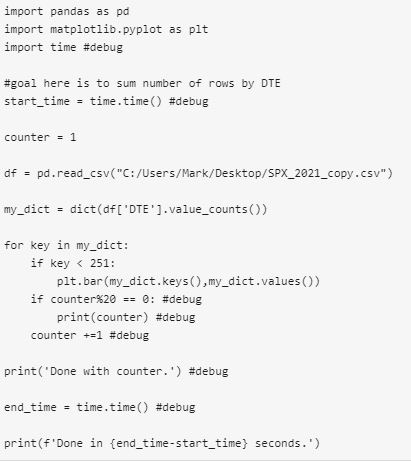
The last line prints out as ~50 seconds, but it takes an additional ~100 seconds before the graph renders and execution concludes. What’s taking the additional 100 seconds? And why does it take even 50 seconds to loop through the dictionary? The dictionary has 717 key-value pairs, which doesn’t seem like that much. These questions remain unanswered.
Iterating over the dictionary is not uniform. It goes slowly until about 200-300 and then prints up to 500 in an instant, to 700 and done. The last 400 or so are lightning fast while the first 200-300 are really slow. I get similar results with this code in Spyder and Jupyter Notebook.
The if statement explains this lack of uniformity. The program should go faster for keys > 250 since nothing is to be done. Only qualifying keys are to be plotted.
Is the conditional statement evaluating dictionary order or value of the key (not to be confused with the key’s corresponding value)? Consider the dictionary {3:29, 8:32, 1:16}. Keys under 10 include the first and second one (or 0th and 1st one given zero-indexing). If this referred to order, then all keys would be under 10 since only the dictionary has only three keys. This doesn’t make logical sense since dictionaries are unordered.
That keys are evaluated in terms of inherent value is verified by this code:*
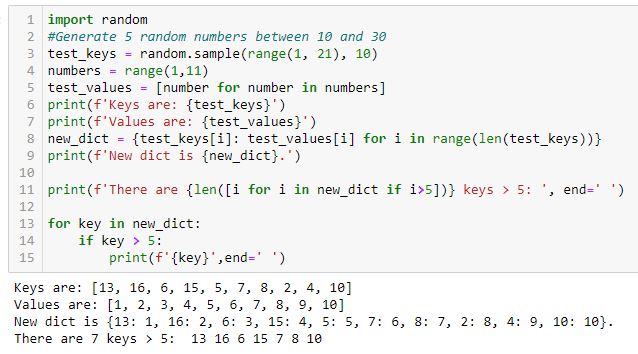
As I run this code over and over several times, I get a varying number of keys > 5 in the last line. If the conditional referred to order, then five keys > 5 would always be identified (i.e. the sixth, seventh, eighth, ninth, and tenth).
The moral of this story is hard to say. I definitely don’t want to plot every point every time. I want to iterate over each point and plot if it qualifies. Even better, probably, would be plotting all points at once. That might also save more time. I need to study the code closer to figure out how to do that.
* — Line 2 should read: “generate 10 random numbers between 1 and 20.”
Dictionary Struggles in Python (Part 1)
Posted by Mark on January 4, 2022 at 07:08 | Last modified: November 10, 2021 09:54Today I want to go over some dictionary lessons learned from a recent Python exercise.
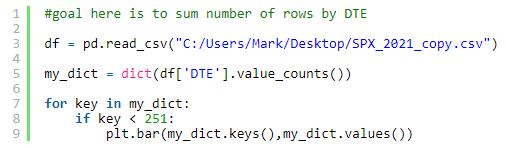
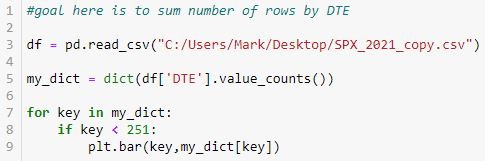
My goal was to go through the 2021 .csv file and sum/graph number of rows by DTE. I had trouble to start, so I capped the initial range at 250.
I started with this:
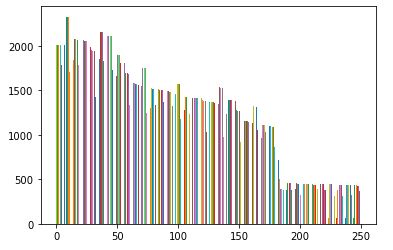
The result was this:
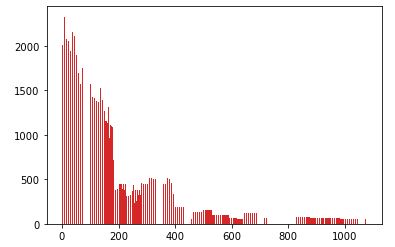
Two unexpected things happened: x-values larger than 250 show up and the program takes nearly two minutes to run.
My first mistake is using .keys() and .values(), which generate lists of all keys and all values when I only want keys < 251 and their single corresponding values.
Not only are all key-value pairs plotted, what can't be seen is that they are plotted many times. All key-value pairs are plotted whenever a key under 251 is found. The dictionary has length 751 with 184 keys < 251. I believe a total of 751 * 184 = 138,184 total points are plotted.
I eventually modified the code as follows:
This takes ~0.5 seconds, which is a substantial performance improvement. In addition, when a qualifying key is detected through the iteration process, only the corresponding key-value pair (rather than the whole dictionary) is plotted.
I will continue next time.
Categories: Python | Comments (0) | Permalink