Calendar Backtesting the COVID-19 Crash (Part 7)
Posted by Mark on December 27, 2021 at 06:04 | Last modified: November 9, 2021 06:36I have been discussing impressions from calendar trade backtesting the 2020 COVID-19 crash.
One loose end from Part 6 was directional bias in my second backtest (top graph):
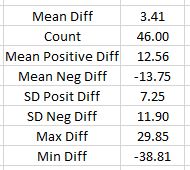
I calculated strike price minus SPX price (“Diff”) for 46 cases of trade entry or adjustments. In the top row, positive (negative) numbers indicate a bullish (bearish) bias. 3.41 points represents a mean bullish bias of 0.1% based on the mean SPX price 3654: hardly anything at all. Standard deviation for positive/negative differences ranges from 7-12 points, which suggests 3.41 will not be statistically significant.
My backtesting guidelines for the bullish single calendar are as follows:
- Enter single PCal in monthly expiry with short leg at least 56 DTE and delta -0.60 to -0.65.
- Exit no later than 21 DTE.
- No additional downside management.
- Upside management: if up at least 20% and underlying crosses above strike, exit trade and start anew.
- Upside management: if underlying is above strike and TD falls below 4, exit trade and start anew.
- Assess $0.21/contract for transaction fees.
Here are the ONE results:
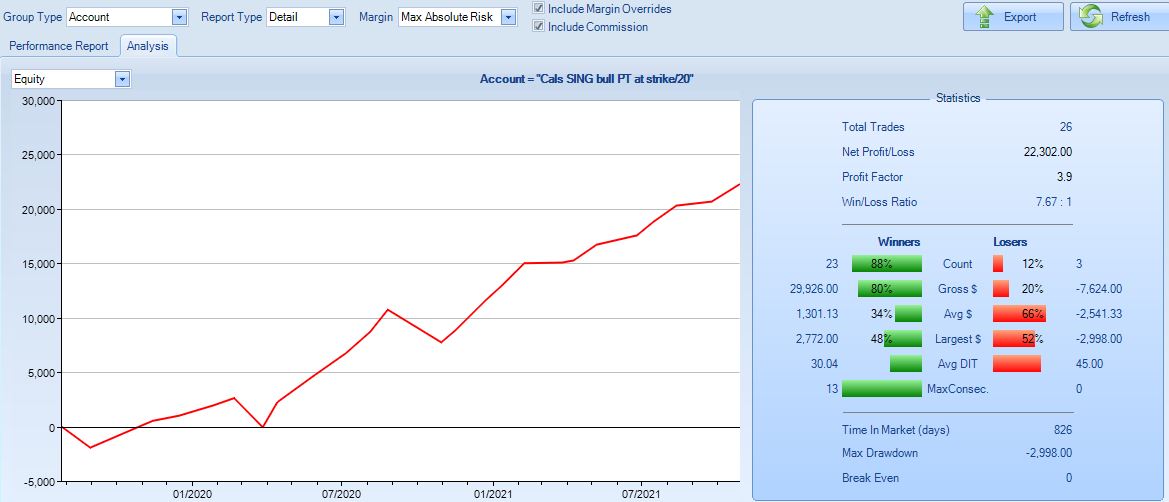
Profit factor is 3.9 with 88% winning trades. This is really too good to be true, and you know what that means…
Directional bias here is ridiculous. The market won’t always be rallying like it did from Mar 2020 through Oct 2021:
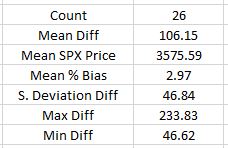
Mean bias is 3% bullish with the average DIT 32. This implies an average annual SPX return of 34% when over decades this is said to be closer to 9-10%. For the longer term, I can see leaning 1% bullish. Perhaps that is my next backtest to run.
This strategy is dangerous because it lacks downside management. Trades beginning on 7/26/19 and 2/21/20 have maximum drawdowns of 90% and 84%, respectively. Being so close to -100%, this does not leave much room for a stop and it can destroy account equity (based on three losing trades, which is a very small sample size). The risk graph shows when leaning this bullish, losses can be hit even with the market slightly down:
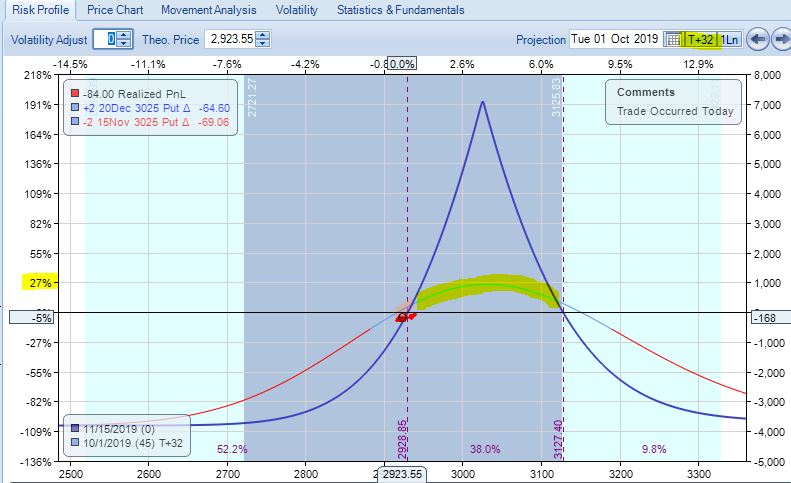
I’m also including this graph to get additional perspective on why DCs are not as advertised. Note how this tent peaks around +191%. With a DC in place, even if one of the two calendars suffers huge losses (e.g. 50-100%), the potential for +191% is enough to offset that. Unfortunately, +191% is not available 32 days into the trade. At that point the highlighted line, which peaks at +27%, is a more realistic estimate (assuming no IV changes). If one calendar is up 27% and the other is down 54% then we will still have major losses to deal with. Holding until 14 DTE gets the highlighted line closer to +68%, which still falls short if the second calendar is facing drawdowns akin to those mentioned two paragraphs above.
As option traders, we would probably benefit by hiding the expiration curve entirely since it’s usually too good to be true.
Categories: Backtesting | Comments (0) | PermalinkCalendar Backtesting the COVID-19 Crash (Part 6)
Posted by Mark on December 24, 2021 at 07:27 | Last modified: November 8, 2021 07:32Today I continue discussing my impressions from calendar trade backtesting the 2020 COVID-19 crash.
I left off showing results for a single-only calendar strategy, which is a contrast to guidelines from Part 1. When I said these results are not encouraging, I was comparing with backtest #2 (summarized in Part 3) whose ONE results look like this:
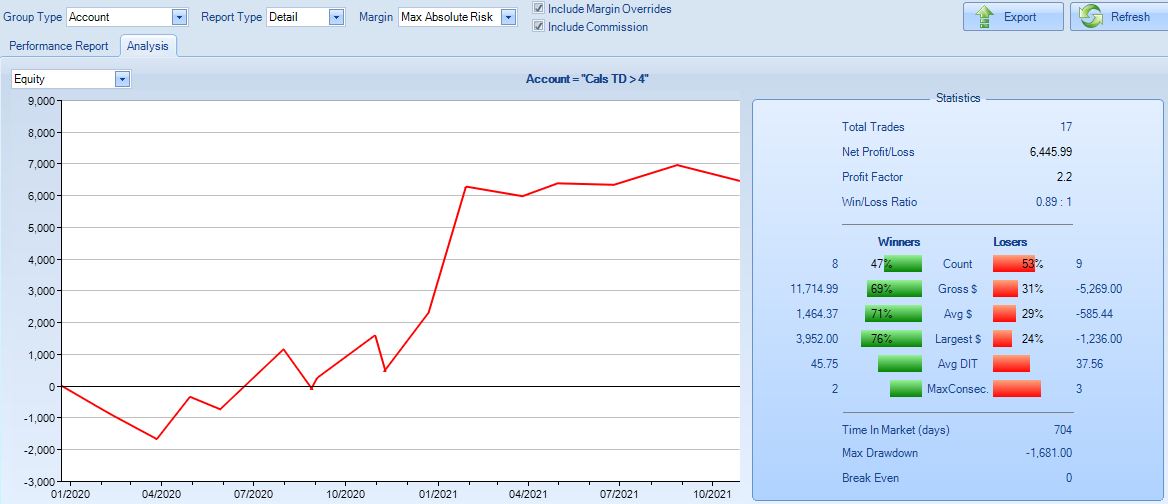
PF is 2.2 and average win is 2.5x average loss. Net profit is much better. I would certainly consider trading this. The DC allows me to hold a losing calendar longer because it also includes one that is winning.
I’m still not totally sold on DCs. Perhaps single calendar results can be improved if I hold a losing trade longer.
This is really suggesting a directional bet. Holding a losing calendar longer means dropping the TD > 4 criterion. This usually happens when the market is above or below the calendar strike, which implies a bearish or bullish bet, respectively.
Given directional choice, I would certainly bet bullish. I mentioned the upward bias to equities in the fourth paragraph here, in the last paragraph here, and in the tenth paragraph here.
Before I decide how to implement this, I want to consider how even the ONE results shown above might be improved. Number of losers still exceeds number of winners, which is not ideal. Also, profitability is concentrated between Apr 2020 through Feb 2021 (10 months). The rest is equity curve chop, which makes me question consistency. A larger sample size of years leading up to 2020 would broaden the context.
I should check to see what directional bias I already have in the trade. I did not intend any, but starting each trade at the nearest 25-point strike implies a tiny bit. Number of times I leaned bearish and bullish should roughly balance out.
I will continue next time with backtesting a bullish calendar trade.
Incidentally, I clicked [the lower box] to see the following ONE results:
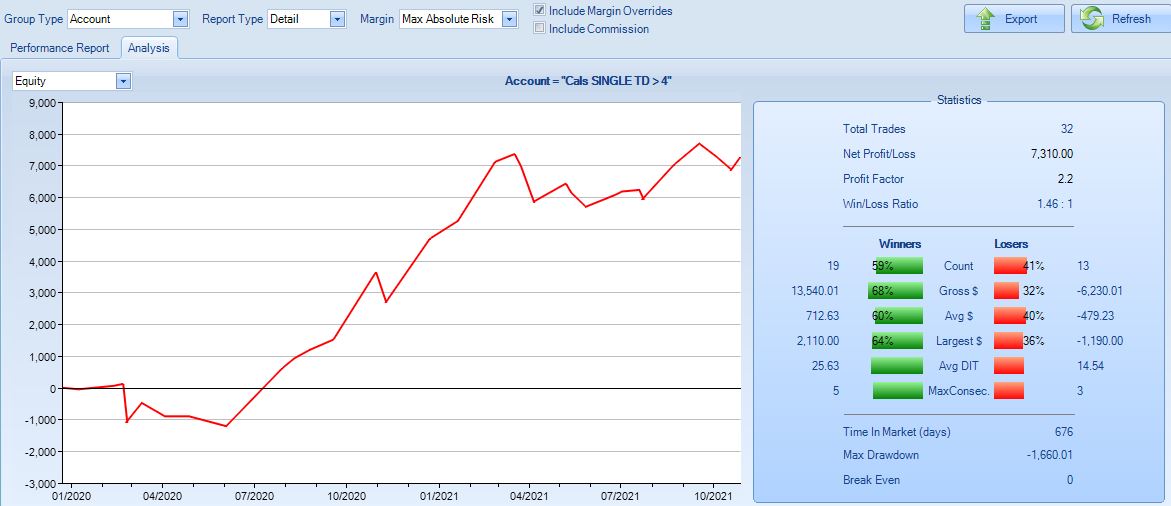
Compare this to the graph shown above. This also has a PF 2.2 and number of winners exceeds number of losers. This appears to be a more consistent strategy.
Unfortunately, these results are a mistake. I accidentally turned off commissions, which eliminates transaction fees. This is fantasyland and we have known this for a long time (see third-to-last paragraph here and fourth-to-last paragraph here).
If I significantly overestimated slippage, then the single-only calendar strategy with no directional bias might be worth doing. This would then be another instance like that described in the second paragraph here. Any backtest where I stack the odds against and performance still comes shining undeniably through is a strategy with which I really want to go live.
Categories: Backtesting | Comments (0) | PermalinkCalendar Backtesting the COVID-19 Crash (Part 5)
Posted by Mark on December 21, 2021 at 07:07 | Last modified: November 6, 2021 09:04Today I continue discussing my impressions from calendar trade backtesting the 2020 COVID-19 crash.
The bigger point with which I left off is that a cursory check (at least) to authenticate a backtest should always be done. No backtest is Truth and live trading is often not exactly per guidelines. Some traders are more discretionary than others and some couldn’t replicate a set of backtested trades even if they really wanted to. Nevertheless, in a backtest like this or this with a limited number of trades and a short time horizon, one mistake can materially affect results.
I’m not sold on double calendars (DCs) because overall, they don’t seem to grow profit as quickly as singles. This is subjective and anecdotal, but I’m going to try and put some reasoning behind it.
DCs are more risky than single calendars for two reasons. First as mentioned in Part 4, being established through adjustment implies less time to recoup transaction fees. Second, being established later means more gamma risk where substantial market moves can result in big losses. DCs need not be riskier from a margin standpoint, but the greater gamma risk is pervasive and insidious. This matters in the face of large market moves, which are a reality in trading.
To control gamma risk, I could implement a minimum DTE limit beyond which only closing contracts and re-entering farther out in time would be permitted. Theoretical determination of this optimal drop-dead date would be very challenging.
Another possibility would be to allow just single calendars. When an adjustment point is hit, exit and enter anew with at least 56 DTE. Here are the OptionNet Explorer (ONE) results of such a single calendar backtest:
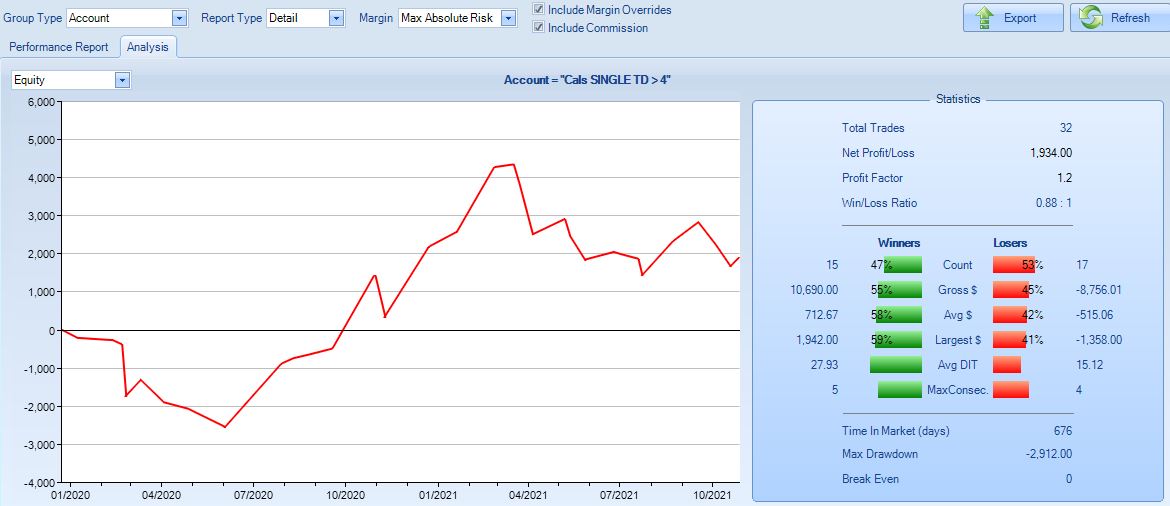
This is not encouraging. Profit factor (PF) is only 1.2 and number of losers exceed number of winners.
In running this backtest, I felt the market often moves around too much for a single calendar to contain it. This led to more frequent whipsaws than backtest #2 (Part 3) where DCs are permitted.
In running this backtest, I also became very cognizant of how quickly a single can lose money when the market moves away from the strike. DCs looks appealing with the wide profit tent, but one calendar is always losing money as the market trends. This may explain why profit seems to develop slowly. Day steps would do a better job at revealing extent to which the expiration curve is mere mirage. This is usually the case with my option trading, but perhaps it’s more pronounced here.
I will continue next time.
Categories: Backtesting | Comments (0) | PermalinkCalendar Backtesting the COVID-19 Crash (Part 4)
Posted by Mark on December 16, 2021 at 07:41 | Last modified: November 5, 2021 11:40I left off asking about a subtlety that would probably be identified by only serious option traders. Submitted for your approval is a question about why one backtested calendar is ~30% more expensive than all the others. Were you able to explain it?
The nuance here is that calendars generally get more expensive when purchased closer to expiration. To lower the cost, I would generally go farther from expiration, but that is not the case with the Sep/Oct calendar I mentioned in the second-to-last paragraph of Part 3. The calendar I backtested was an Oct 3225 put priced at 24.09% IV and a Nov 3225 put priced at 26.24% IV. Is that normal contango? I’d have to survey a large sample size to find out but my guess is no.
I suspect two factors have contributed to make this calendar atypically expensive. First, it is 35 days wide. This happens four times per year [(4 * 5 weeks in between mos) + (8 * 4 weeks in between mos) = 32 + 20 = 52 weeks for the full 12 mos] and it means paying for one extra week of extrinsic value in the long leg.
Second, and what I believe to be of greater importance, is the 2020 presidential election. I think the Nov options are priced rich due to election uncertainty.* On 7/31/20, IV for Nov and Dec are 24.55% and 24.66%, respectively (beyond which term structure decreases). Purchasing the Nov/Dec 2020 112/140 (DTE) calendar would cost $4,650: much less than the $8,840 seen here. The horizontal skew on the Nov/Dec would be -0.19, which is much lower in magnitude than -2.15 for the backtested Oct/Nov. Term structure rises steeply through November and then starts to trail off. This is unusual.
Incidentally, I’m puzzled why I exited this adjusted DC at 43 DTE when a third adjustment point was hit on 9/3/20 to open a single Nov (78 DTE)/Dec calendar. I could have rolled to ATM, as the presenter’s guidelines suggest (green):
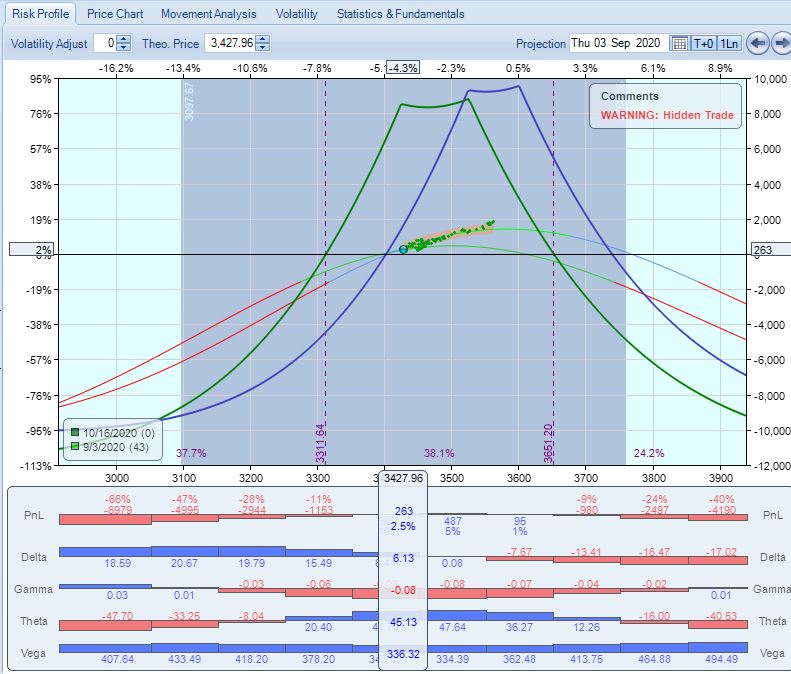
I could have also gone an extra 100 points OTM (green):
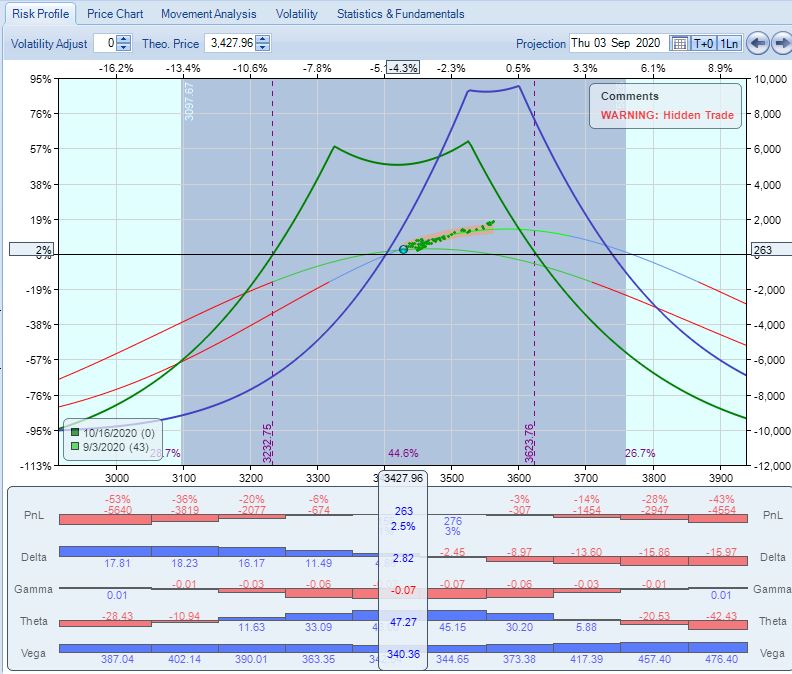
Theta is comparable for both and cost is slightly less for the latter. TD is even higher for the latter (17 vs. 7). Either of them look doable. Every time I adjust a calendar, PnL gets dragged down a bit by transaction fees. Since it usually takes a few days of positive theta to recoup that, maybe I should never adjust too close to my drop-dead 21 DTE. That is no excuse here with 43 DTE and plenty of time left.
I will continue next time.
*—As an exercise for another post, I should plot this term structure in Python. An additional
detail would be to scale the x-axis properly since data points start one month apart and
later increase to points that are three months apart.
Calendar Backtesting the COVID-19 Crash (Part 3)
Posted by Mark on December 13, 2021 at 06:52 | Last modified: November 4, 2021 11:32Today I continue discussing calendar trades, which I recently revisited after viewing an online presentation on performance during the COVID-19 2020 crash.
I left off explaining that my second backtest was an attempt to be well-defined compared to the first, especially with regard to margin by implementing a constant number of contracts. No more starting out with one contract, adjusting by adding another, taking it away, etc. Also, no more double calendars with different expiration months, which may be regarded as different numbers of contracts from a theta perspective (e.g. on Jan 3, a Feb/Mar calendar will generally generate more positive theta than an Apr/May).
The second backtest returned $7,681, which seems significantly higher than the +$5,072 from the first backtest. Looking closer, though, $7,681 on a maximum margin of $10,074 is 76.2% ROI, which is only slightly better than 65% for the first backtest. The latter ROI is based on a max margin of $7,775.
With all that effort given to maintaining a constant number of contracts, why is max margin ~30% higher in backtest #2?
Here is the trade list from the second backtest:
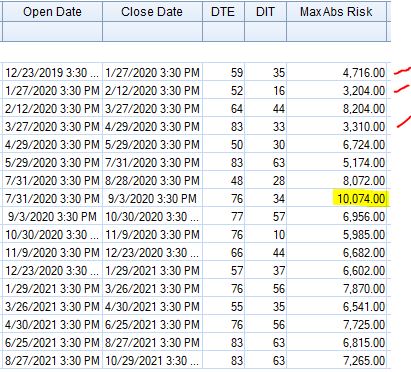
Looking down the “MaxAbsRisk” column, the first thing I noticed was the highlighted $10,074. This intuitively seemed to be about 25% more than the rest, but a look across the entire distribution suggests otherwise. Note the low values marked with red. Going one step farther, the standard deviation of these numbers is 1756. For the first backtest, the standard deviation of max risk (recorded after every trade) is 1734. Evidently, consistency across number of contracts (check!) is not the same as consistency across nominal risk (miss!). I could normalize the latter by selecting a position size (e.g. $10,000 or arguably X% of account value) and always trading the number of contracts coming closest to matching it.
The $10,074 trade bothered me enough to take a closer look for understanding. I opened that PCal 28 points OTM on 7/31/20. This appears to be a choice (maybe an attempt to bias the backtest negatively as mentioned in the second paragraph here) to lean bearish because I could have placed it 3 points OTM or 22 points ITM (bullish). Either way, all three of these have similar cost and therefore would not explain the anomaly.
Instead of doing the 77/112 (DTE) Oct/Nov 2020 calendar for $8,840 (initial margin), I could have [violated the guidelines and] opened a 49/77 Sep/Oct 2020 calendar for $7,190. This would have replaced a winning trade with a losing one and instead of making $7,681 on $10,074 (max risk ever seen on any trade) for +76.2% ROI, the strategy would have returned $6,099 on $8204 for +74.3% ROI: pretty much the same.
Did you catch that? Something strange is afoot. If it rattled your bones the first time you read it, then you certainly deserve a free pizza for prowess!
*—I should plot this distribution in Python as an exercise for another post.
Calendar Backtesting the COVID-19 Crash (Part 2)
Posted by Mark on December 10, 2021 at 07:18 | Last modified: November 4, 2021 10:37I recently viewed an online presentation about a monthly calendar, which motivated me to revisit the strategy.
As mentioned in Part 1, I backtested a second time because my results fell short of the advertised +100% return. As also discussed, I wasn’t overly concerned about this because he did not offer details about his trades or his calculations.
Although I didn’t consider it after completing the first backtest, I probably overestimated slippage with $21/contract. Factoring in too much slippage can result in backtested returns falling short of live-trading counterparts.* I would be curious to know what slippage the presenter realized on his trades. I have a feeling very few actually track this. I do it by noting difference between my limit and midprice. Once my order is executed, I look immediately at the mark to see how far off I got filled.
I did give serious consideration to the fluctuating number of contracts that is typical of rolling calendar trading strategies [beyond the current scope is an entire debate awaiting to be had over this approach]. If I start with one calendar and adjust by adding a second, then I have roughly doubled margin. Trading strategies generally need consistency to be successful. Cruising along winning 1, 1, 1 on single calendars only to suddenly hit turbulence and lose 4 on a[n] [adjusted] calendar with double the margin can be very painful (see third-to-last paragraph here).
In my initial backtest, much of the profitability took place with one contract in place rather than two. Calendars make consistent profits when the market trades sideways. A cursory scan through the backtest shows 288 trading days with one contract and 163 trading days with two. As a weighted average, I was trading 1.36 contracts per day, which is 68% of the full 2-contract position size. I would expect a lower return with a smaller position size because maximum risk (denominator), is equal. Maximum risk relates to the largest position size ever seen whether it happens once, 36% of the time, or always.
In the subsequent backtest, I implemented two contracts at all times. I started with two and rolled one of two when I had to adjust. I paid much closer attention to when trades started and when they ended. Rather than ever having calendars with different expiration months on at the same time (e.g. Jan/Feb and Feb/Mar), I closed the entire position and started a new trade with the short leg around 60 DTE.
I will continue next time.
*—So many other things can also affect the comparison including strike prices, DTE of
individual trades, timing of adjustments, etc. It’s also worth noting that difference in
the headline return may not be statistically significant (see bottom of this post).
Calendar Backtesting the COVID-19 Crash (Part 1)
Posted by Mark on December 7, 2021 at 07:23 | Last modified: November 4, 2021 09:14I recently saw a presentation extolling the virtues of a monthly calendar trade. I have backtested calendars in the past without convincing results. After seeing this presentation, I decided to give another look.
The presenter claimed to be a full-time trader for several years. He said he has now traded calendars for at least two years. He traded through the COVID-19 crash and did well. This gives him the confidence to trade calendars in any environment because March 2020 was “the worst thing to happen to the market since 9/11.”
These are his official guidelines on trade setup and management:
- Buy calendar 60-80 DTE with long leg 30 days farther out in time.
- NPD < 30% of NPT
- If NPD too high/low, buy second calendar ATM to form a DC.
- Manage by TD ratio and maintain position under profit tent.
- Profit target: 15-20%
- Exit around 30 DTE (no later than 21 DTE).
My initial backtest guidelines were as follows:
- Buy ATM PCal with ~60 DTE and one month between legs.
- Monitor TD ratio daily and adjust if < 4.
- Adjust by adding second calendar ATM or slightly OTM to raise TD > 4.
- If TD < 4 again, close OTM calendar and continue.
- If adjustment results in “excessive” sag between strikes, then reposition with 60-DTE ATM calendar.
- Rinse and repeat should further adjustments become necessary.
- Exit no later than 21 DTE.
- Assess $21/contract to include $0.20 slippage and $1 commission per contract.
From 12/23/2019 – 10/29/2021, this returned $5,072 on maximum risk $7,775: +65.2%. Over the period, SPX ↑ 42.4% from 3225 to 4594. Max drawdown was -47.4% (-$3,684) on 3/23/20 compared to -31.7% (2203) for SPX on the same date.
The calendar strategy performed comparably (risk/return) to the underlying index, but the presenter said he returned +100% in 2020 alone. Did I do something wrong?
I should never get overly concerned about discrepant performance statistics when I do not exact details about presenter calculations or accuracy. He may have rounded up to 100%—to the nearest 1%, 10%, or 100%!
While I don’t know these details about the presenter, a more detailed look at my methodology reveals:
- I managed only by TD—not minding whether trade remained under the tent.
- I usually closed at 21 DTE and adjusted as late as 24 DTE.
- I did not implement a profit target.
- I opened trades near 60 DTE going as short as 56 DTE.
- I used only 25-point strikes.
- I conducted one long campaign rather than grouping entries and exits into separate trades.
When others present results, I seldom find them forthcoming with a comprehensive, accurate account of methodology enabling me to replicate/verify the numbers. Changing any of these details can affect performance calculations. Live trading results are even worse because some degree of discretion is almost always present. A list of trades can provide opportunity for verification, but this was omitted as well.
I will continue next time.
Categories: Backtesting | Comments (0) | PermalinkFuture Content Related to Python Backtester
Posted by Mark on December 2, 2021 at 06:36 | Last modified: September 17, 2021 15:25Although I haven’t blogged in two months, the time has come to give an update on the long-sought-after option backtester.
As it turns out, I met a guy through a trading website who has been programming for decades. He’s a Python expert! He’s had a few different fits and starts with regard to trading and investing over the years, but he recently hit true retirement and thankfully has an interest in working with me to develop the trade backtester about which I have written much in the past.
In the last 18 months, I have taken a closer look at some automated backtesters on the market. In particular, I have researched eDeltaPro, getVolatility, and CMLviz TradeMachine. I did a detailed review about the latter. In coming posts, I will publish my findings on the other two. I really want our backtester to be something beyond what is currently available and to achieve that, we need to identify what has already been done.
This software will not be for commercial use. I am quant- and statistically-minded and looking to combine basic strategies to see how they fit together. The level of complexity will far surpass what introductory traders need. With regard to advanced retail traders out there who have studied and/or possibly developed some of these multifaceted approaches on their own—well, I don’t personally know any, as alluded to in the sixth paragraph here.
I don’t want to start a software company where I would be required to offer tech support.
I don’t really want to be an investment advisor selling my employer’s products.
I don’t really want to go into trader education: that’s a whole other industry of its own and would detract from my main focus.
As mentioned in the third paragraph here, I do want to remain on the quant-related course I have been following.
After reviewing the other two software solutions mentioned above, I will focus on some YouTube content I have been perusing. Videos are available on a wide variety of trading subjects. Some have captured my interest with regard to backtesting methodology. I will analyze these in a manner similar to this lengthy blog series in an attempt to gain a broader perspective on how we may go about backtesting different approaches.
Finally, I will start reviewing some Python concepts that will be integral to the backtester as a way to solidify my own personal understanding of the language.
Coming attractions, y’all!
Categories: Backtesting | Comments (0) | Permalink