Call Me Crazy (Part 7)
Posted by Mark on June 24, 2021 at 07:43 | Last modified: May 31, 2021 11:02Last time, I discussed the risk to long calls (LC) posed by flat/down years on the stock market. Today I want to turn up the volume a bit by considering multi-year weak markets.
A multi-year bear market is one of my greatest fears because LC loss will be additive from one year to the next. Part 6 includes a table where I isolate the down and flattish years from my 14+ year backtest. Only in 2007-2008 do we see back-to-back down/flattish years. This does not hurt the LC account very much because 2007 ends roughly unchanged. Only when I add March 9, 2009, as part of the enhanced data set do we see the 32.8% drawdown shown here. Although 2009 doesn’t end at that level, we begin to get a sense of the toll taken from consecutive down periods.
A market that declines over a series of years could result in major losses. Let’s look at Tokyo’s Nikkei index. Japan experienced a deflationary recession from ~1990 through at least 2011 where share and property price bubbles burst:
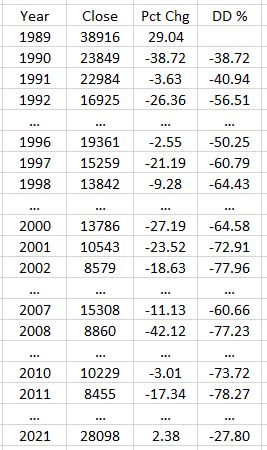
In a 12-year span, we see three instances of back-to-back-to-back down years. I can imagine a LC account down 20% in 1990, down 7% in 1991, and down another 20% in 1992 for a total hit of ~45-50%. This is an improvement over the underlying shares but still major damage. While the Nikkei average rebounds roughly 13% over the next three years, I can then imagine the LC account down 5% in 1996, 15% in 1997, and 13% in 1998 leaving it only marginally ahead of the underlying shares. Conservatively estimating a 10% each decline for 2000-2002, the LC account would pretty much go bust (worse than the underlying shares) were I not to make any changes to the trading strategy over all this time.
The “lost decade” for our beloved SPX perils in comparison to what Japan has experienced. From the end of 2000 through the end of 2010, SPX lost 4.7%. Looking closer reveals something much tamer than the Nikkei with only four down years and five consecutive up years (2003-2007) during this period that dealt US investors so much pain.
Zooming out, since 1928 the SPX has had some rockier periods:
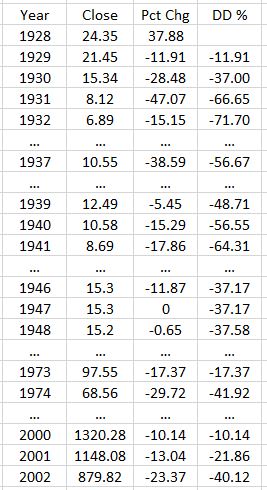
The last row will change through the end of this year. The value shown is from May.
1929-1932 is the only instance I can find of four consecutive down years on a stock market. I can easily imagine a LC account losing 60% during this span. While this might outperform underlying shares, it is catastrophic loss nonetheless. The table also shows other cases of back-to-back-to-back down/flattish years that would really hurt a LC account invested as prescribed.
After looking at these data, I am tempted to wonder whether the last 20 years (including the entire LC backtest) hasn’t been a remarkable gift. I often hear people predicating investment theses on things like “the stock market has an upward bias,” or “the market has always taken out new highs and will continue to do so.” I don’t think it has to be this way, I sure as heck don’t think it always will, and when the next bear market sticks around for more than what amounts to a flash in the pan (COVID-19 scare in Feb-Apr 2020), I need to be be sure that my trading strategy can withstand it.