Call Me Crazy (Part 3)
Posted by Mark on June 7, 2021 at 07:13 | Last modified: May 18, 2021 11:22Today I want to contrast backtesting results presented in my last post between the long call and underlying shares.
While mulling over the results, I questioned whether I was doing a valid apples-to-apples comparison with regard to position sizing. Initial account value was $100,000 for each yet with SPX at 1416 on 1/3/2007, the notional value of one 1425 call is not $100,000 but rather [ ( underlying price – points OTM) * 100 ] $140,700.
This apparent discrepancy is much ado about nothing. Changes in underlying account value are proportional to changes in the underlying itself, which is what I used to calculate max drawdown (MDD). MDD may be calculated as a percentage, thereby normalizing for any scale difference. In reality, one long call may control more or less stock than the arbitrary $100,000 initial account value and is not germane to this discussion.
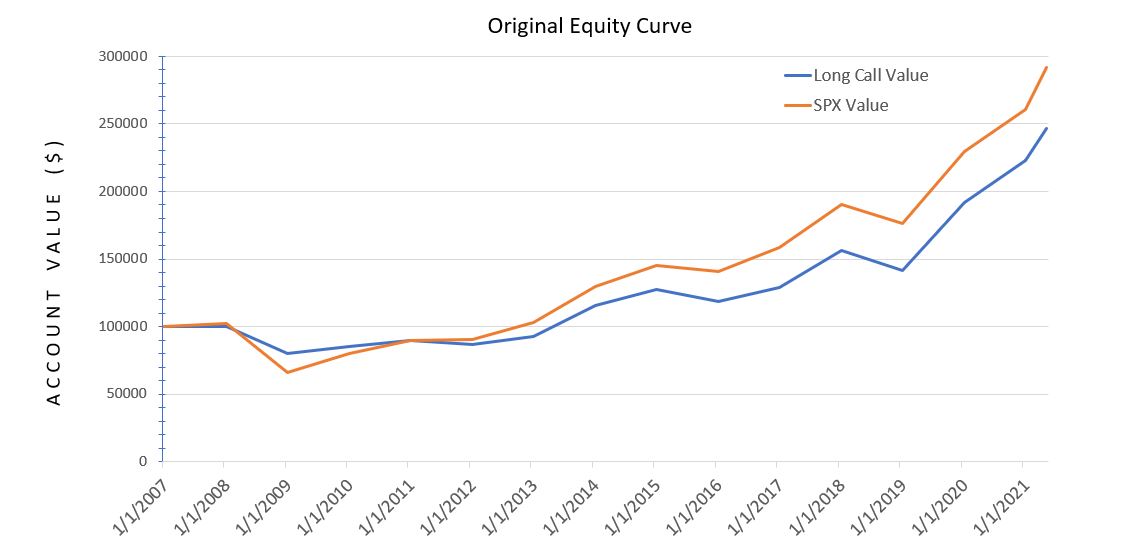
With that resolved, I now feel comfortable to show this:
The greater stability of the long call (blue line) is seen in terms of a higher low and subsequent lower high. Aside from that, I think the table presented last time did more to illuminate differences.
What we really don’t see, which I continue to contemplate as a potential game changer, is the peace of mind coincident with a blue line that cannot lose any more in one year than it did in 2008. I will talk more about this later.
Speaking of psychology, both curves are deceptively smooth because they only contain one data point per year. The market moves around much more than this. While sharp selloffs can impart great fear among investors, owning a long call during a 2008-like selloff may put me near a loss level beyond which I can lose no more. I am therefore freed of the temptation to exit, which for shares often locks in catastrophic losses at the worst time (see last paragraph here). By holding on at market-crash lows, the only way for the call investor to go is up.
To get a better sense of actual volatility, I backtested 24 additional days between 2007 – 2020 where the underlying market hit near-term lows:*
The total return and starting/ending points are all the same in this enhanced graph. The additional data points highlight more of the downside volatility actually experienced.
Between the long call and long shares, MAR by MDD differs less in the enhanced data set than it does in the original: 3.27:1.99 (enhanced) versus 5.30:3.02 (original).
Why is this?
Next time, I will continue with a brief excursion into the weeds.
* — The actual MDD for all 5,244 days is not captured because I did not backtest any near-term highs.

