Mathematical Excursion
Posted by Mark on June 10, 2021 at 07:03 | Last modified: May 18, 2021 15:15I left off by explaining the difference between MAR by MDD as more extreme for the original data set than for the enhanced data set. Since this seemed counterintuitive to me, let’s take some time to explain it.
I expected long call MAR by MDD to shine even brighter compared to shares given the enhanced data set. After all:
- I used the same formula for both: (100 * Geo. Mean) / MDD %.
- Between the start of 2009 and the market low on 3/9/2009 (additional enhanced data point), the long call account dropped from $79,956 to $67,309: -16.8%.
- The SPX account dropped an even greater percentage from $65,777 to $47,757: -27.4%.
What actually matters is not whether the SPX account dropped more during the additional 66 days but rather how the drop over the additional 66 days compares to the original Jan 2008 – Jan 2009 decline. For a proportional drop in both the long call and shares, I would expect the ratio of the enhanced RAR by MDD to be the same. With 1.0 reflecting proportionality, the ratio of MDD % for long call is 0.56 for the original data set and 0.62 for the enhanced thereby suggesting the drop is closer to proportionate through 3/9/09 than it is through Jan 2009. Put another way, the more proportionate additional 66 days dilutes RAR by MDD for both the long call and underlying shares.
A table may help:
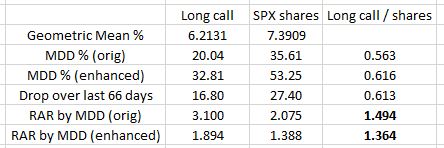
The numbers in bold are what puzzled me. The first and third numbers in the same column explain why. The ratio between MDD % is closer to 1.0 in the last 66 days, which evens out the overall comparison if only by a small amount.
Coincidentally, the ratio of the drop over those last 66 days (third number, last column) is very close to the ratio of MDD % for the enhanced data set. This got me thinking why these two numbers might be the same. They are not the same, though: 0.616 vs. 0.613. Pure coincidence.
When comparing RAR between groups, I make sure to calculate RAR in an identical manner. The idea is to divide return by some measure of risk because greater (lesser) risk should decrease (increase) RAR. I will sometimes multiply by a constant (100 in this case) to make the numbers easier to interpret. The constant doesn’t matter as long as I apply the same to both.
For these reasons, my RAR is not necessarily comparable to anyone else’s.
In and of itself, the term “risk-adjusted return” is non-specific. Different metrics for risk include alpha, beta, R-squared, and standard deviation (SD). The Sharpe ratio is a RAR metric that uses SD as its risk measure. The Treynor ratio is a RAR metric that uses beta as its risk measure.
I worried this excursion might take us out to the weeds. Indeed it has! I come back to reality (hopefully) next time.