Calendar Backtesting the COVID-19 Crash (Part 3)
Posted by Mark on December 13, 2021 at 06:52 | Last modified: November 4, 2021 11:32Today I continue discussing calendar trades, which I recently revisited after viewing an online presentation on performance during the COVID-19 2020 crash.
I left off explaining that my second backtest was an attempt to be well-defined compared to the first, especially with regard to margin by implementing a constant number of contracts. No more starting out with one contract, adjusting by adding another, taking it away, etc. Also, no more double calendars with different expiration months, which may be regarded as different numbers of contracts from a theta perspective (e.g. on Jan 3, a Feb/Mar calendar will generally generate more positive theta than an Apr/May).
The second backtest returned $7,681, which seems significantly higher than the +$5,072 from the first backtest. Looking closer, though, $7,681 on a maximum margin of $10,074 is 76.2% ROI, which is only slightly better than 65% for the first backtest. The latter ROI is based on a max margin of $7,775.
With all that effort given to maintaining a constant number of contracts, why is max margin ~30% higher in backtest #2?
Here is the trade list from the second backtest:
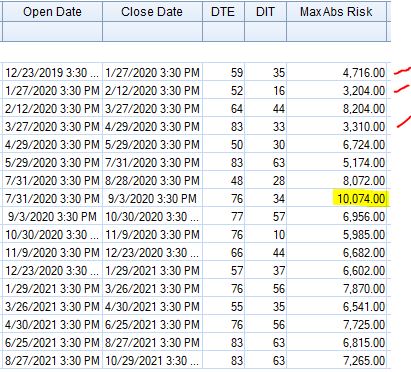
Looking down the “MaxAbsRisk” column, the first thing I noticed was the highlighted $10,074. This intuitively seemed to be about 25% more than the rest, but a look across the entire distribution suggests otherwise. Note the low values marked with red. Going one step farther, the standard deviation of these numbers is 1756. For the first backtest, the standard deviation of max risk (recorded after every trade) is 1734. Evidently, consistency across number of contracts (check!) is not the same as consistency across nominal risk (miss!). I could normalize the latter by selecting a position size (e.g. $10,000 or arguably X% of account value) and always trading the number of contracts coming closest to matching it.
The $10,074 trade bothered me enough to take a closer look for understanding. I opened that PCal 28 points OTM on 7/31/20. This appears to be a choice (maybe an attempt to bias the backtest negatively as mentioned in the second paragraph here) to lean bearish because I could have placed it 3 points OTM or 22 points ITM (bullish). Either way, all three of these have similar cost and therefore would not explain the anomaly.
Instead of doing the 77/112 (DTE) Oct/Nov 2020 calendar for $8,840 (initial margin), I could have [violated the guidelines and] opened a 49/77 Sep/Oct 2020 calendar for $7,190. This would have replaced a winning trade with a losing one and instead of making $7,681 on $10,074 (max risk ever seen on any trade) for +76.2% ROI, the strategy would have returned $6,099 on $8204 for +74.3% ROI: pretty much the same.
Did you catch that? Something strange is afoot. If it rattled your bones the first time you read it, then you certainly deserve a free pizza for prowess!
*—I should plot this distribution in Python as an exercise for another post.