Calendar Backtesting the COVID-19 Crash (Part 7)
Posted by Mark on December 27, 2021 at 06:04 | Last modified: November 9, 2021 06:36I have been discussing impressions from calendar trade backtesting the 2020 COVID-19 crash.
One loose end from Part 6 was directional bias in my second backtest (top graph):
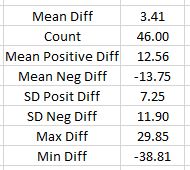
I calculated strike price minus SPX price (“Diff”) for 46 cases of trade entry or adjustments. In the top row, positive (negative) numbers indicate a bullish (bearish) bias. 3.41 points represents a mean bullish bias of 0.1% based on the mean SPX price 3654: hardly anything at all. Standard deviation for positive/negative differences ranges from 7-12 points, which suggests 3.41 will not be statistically significant.
My backtesting guidelines for the bullish single calendar are as follows:
- Enter single PCal in monthly expiry with short leg at least 56 DTE and delta -0.60 to -0.65.
- Exit no later than 21 DTE.
- No additional downside management.
- Upside management: if up at least 20% and underlying crosses above strike, exit trade and start anew.
- Upside management: if underlying is above strike and TD falls below 4, exit trade and start anew.
- Assess $0.21/contract for transaction fees.
Here are the ONE results:
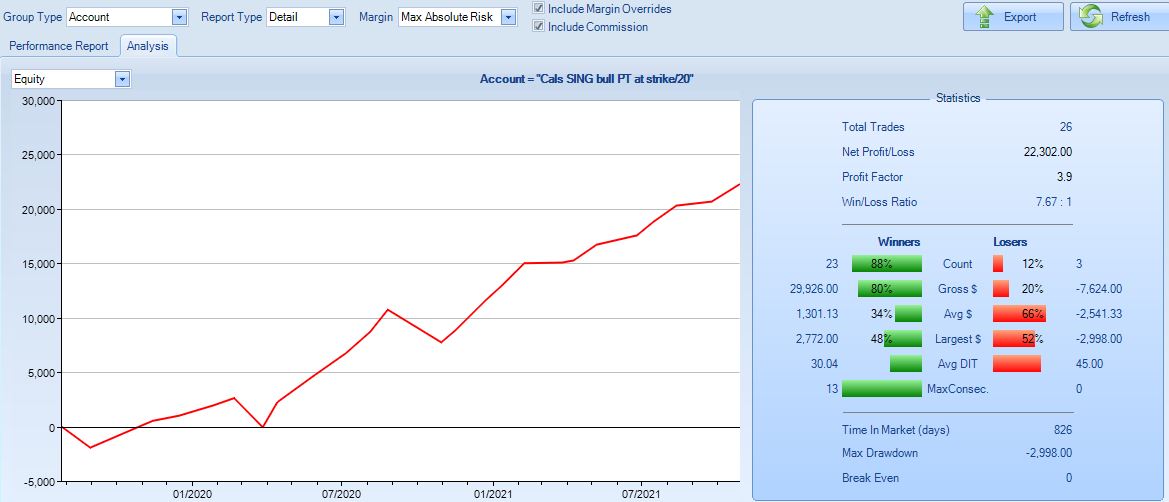
Profit factor is 3.9 with 88% winning trades. This is really too good to be true, and you know what that means…
Directional bias here is ridiculous. The market won’t always be rallying like it did from Mar 2020 through Oct 2021:
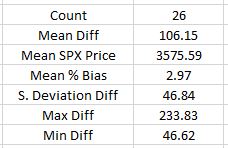
Mean bias is 3% bullish with the average DIT 32. This implies an average annual SPX return of 34% when over decades this is said to be closer to 9-10%. For the longer term, I can see leaning 1% bullish. Perhaps that is my next backtest to run.
This strategy is dangerous because it lacks downside management. Trades beginning on 7/26/19 and 2/21/20 have maximum drawdowns of 90% and 84%, respectively. Being so close to -100%, this does not leave much room for a stop and it can destroy account equity (based on three losing trades, which is a very small sample size). The risk graph shows when leaning this bullish, losses can be hit even with the market slightly down:
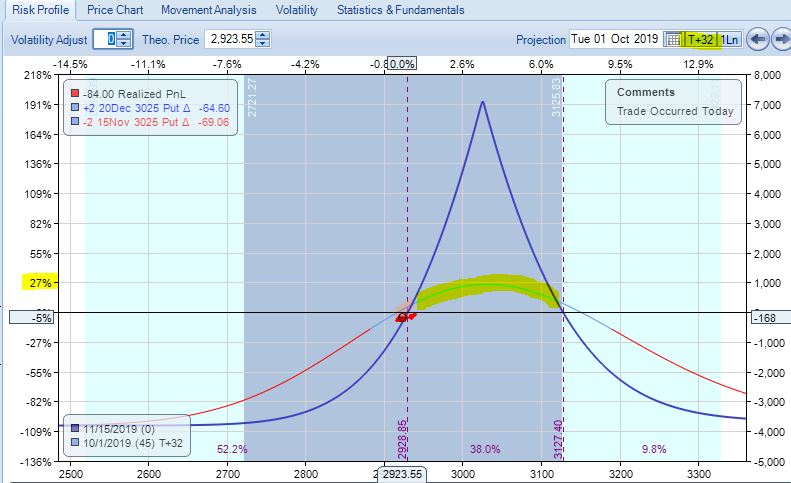
I’m also including this graph to get additional perspective on why DCs are not as advertised. Note how this tent peaks around +191%. With a DC in place, even if one of the two calendars suffers huge losses (e.g. 50-100%), the potential for +191% is enough to offset that. Unfortunately, +191% is not available 32 days into the trade. At that point the highlighted line, which peaks at +27%, is a more realistic estimate (assuming no IV changes). If one calendar is up 27% and the other is down 54% then we will still have major losses to deal with. Holding until 14 DTE gets the highlighted line closer to +68%, which still falls short if the second calendar is facing drawdowns akin to those mentioned two paragraphs above.
As option traders, we would probably benefit by hiding the expiration curve entirely since it’s usually too good to be true.