Dictionary Struggles in Python (Part 1)
Posted by Mark on January 4, 2022 at 07:08 | Last modified: November 10, 2021 09:54Today I want to go over some dictionary lessons learned from a recent Python exercise.
My goal was to go through the 2021 .csv file and sum/graph number of rows by DTE. I had trouble to start, so I capped the initial range at 250.
I started with this:
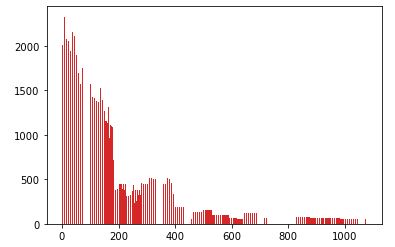
The result was this:
Two unexpected things happened: x-values larger than 250 show up and the program takes nearly two minutes to run.
My first mistake is using .keys() and .values(), which generate lists of all keys and all values when I only want keys < 251 and their single corresponding values.
Not only are all key-value pairs plotted, what can't be seen is that they are plotted many times. All key-value pairs are plotted whenever a key under 251 is found. The dictionary has length 751 with 184 keys < 251. I believe a total of 751 * 184 = 138,184 total points are plotted.
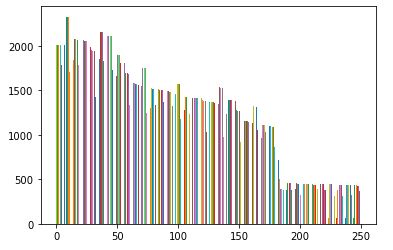
I eventually modified the code as follows:

This takes ~0.5 seconds, which is a substantial performance improvement. In addition, when a qualifying key is detected through the iteration process, only the corresponding key-value pair (rather than the whole dictionary) is plotted.
I will continue next time.


