Short Premium Research Dissection (Part 1)
Posted by Mark on February 21, 2019 at 06:04 | Last modified: November 16, 2018 15:25I recently purchased research from someone on short premium strategies. In this mini-series I will go through the research with a fine-tooth comb and critique it.
I am going to conduct this analysis in much the same way I have previously dissected investment presentations. Many of these offer mouthwatering conclusions. I think it’s important to smack ourselves whenever we get whiff of something sounding like the Holy Grail. We’re all looking for the Grail and we hope to find it even though, in a separate breath, experienced traders would admit no such Grail exists. Being overtaken by confirmation bias (mentioned twice in the final four paragraphs here and in the fourth paragraph here) can amount to some expensive trading tuition, indeed.
The first thing she does is present basic data on short straddles:
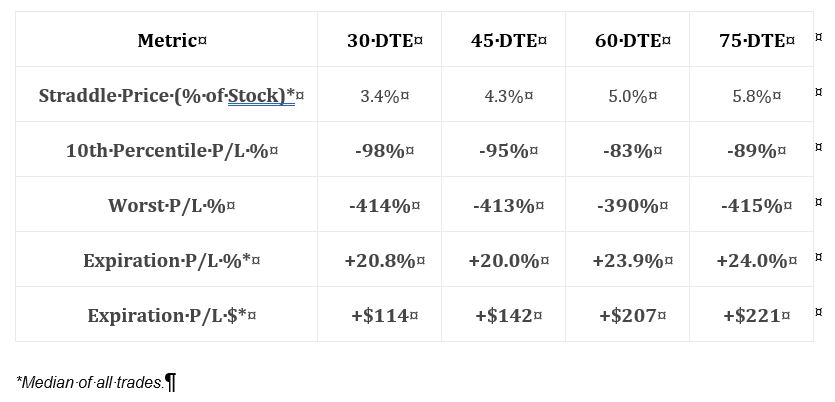
This is an interesting table. I always like to see some reference to “worst trade.” She includes 10th %’ile PnL, which is a great way of giving clues about the PnL distribution. Alone, the average (mean or median) tells very little if the distribution is not Normal. I would have liked to see more percentile data—maybe 5th %’ile (~ 2 SD) and 20-25th %’ile (~ 1st quartile)—to better define the lower tail.
Unfortunately, the methodology used to generate this table is not adequately explained. She writes “2005 to present.” When in 2005? The ending date is also unknown (the document has no publication date, either). The chart implies trades were taken every month at the specified DTE but I need to see total number of trades for verification. Anything more than 30 DTE would result in overlapping trades and much of the document discusses nonoverlapping trades. This could result in a significant sample size difference (larger sample sizes are more meaningful).
Speaking of significant differences, no statistical analysis was applied in this document. This is very unfortunate for reasons discussed here and here. Without number of occurrences and p-values, we cannot put context around whether descriptive statistics are different no matter how they appear.
This table includes more interesting exploratory data:
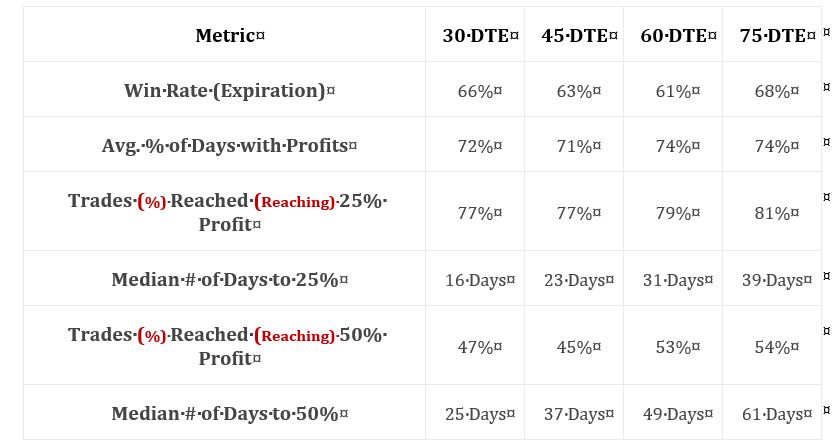
Row 1 indicates suggests a profitable trade, but whether the average trade is profitable depends on the magnitude and distribution (think histogram) of losses. Rows 3 and 5 give insight into the distribution of maximum favorable excursion (see second paragraph here), which can be used to determine profit target. Why set a 50% profit target if only 10% of trades ever reached that level? Rows 4 and 6 give temporal context, which speaks to annualized returns.
I will continue next time.