Maximum Excursion Study
Posted by Mark on May 12, 2017 at 06:45 | Last modified: February 9, 2017 10:23I previously did a study on maximum adverse excursion. Today I will discuss another study I did on maximum excursion (ME) in November 2015.
Excursions can be favorable or adverse. Maximum adverse (favorable) excursion is the largest loss (gain) during the lifetime of a trade. This is abbreviated MAE (MFE).
Although I selected a period of 23 trading days for this study, I should repeat the study over different periods to make sure the results are stable and not fluke. A period of 23 trading days corresponds to roughly one calendar month.
I used index prices for this study and looked at the MAE (downward price moves) and MFE (upward price moves) over the next 23 trading days. The study covered 3,681 data points from Jan 1, 2001, through Oct 29, 2015.
I stratified results by ventiles of a price oscillator (Osc). Osc reflects closing price as a percentage of the 23-day range ending today. Osc may range from 0 to 100. If the index closes today at a 23-day high (low) then today’s Osc reading will be 100 (0). Lower (higher) values of Osc correspond to oversold (overbought) market conditions.
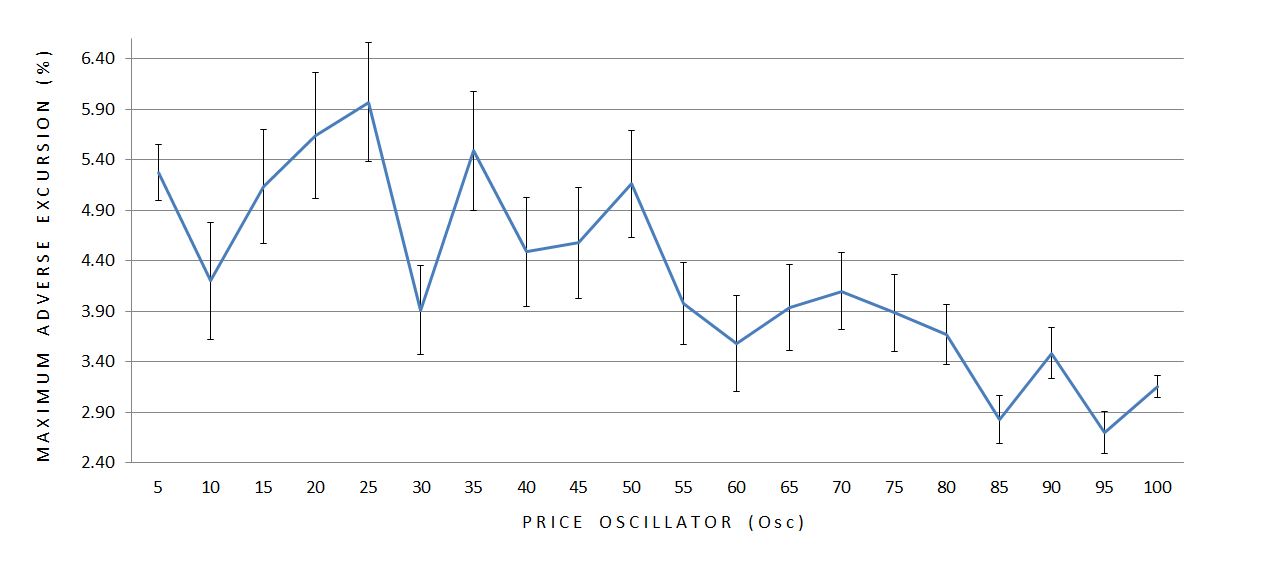
Here are the averages (mean) and standard errors of the mean (SEM) for MAE:
Here are the means and SEM’s for MFE:
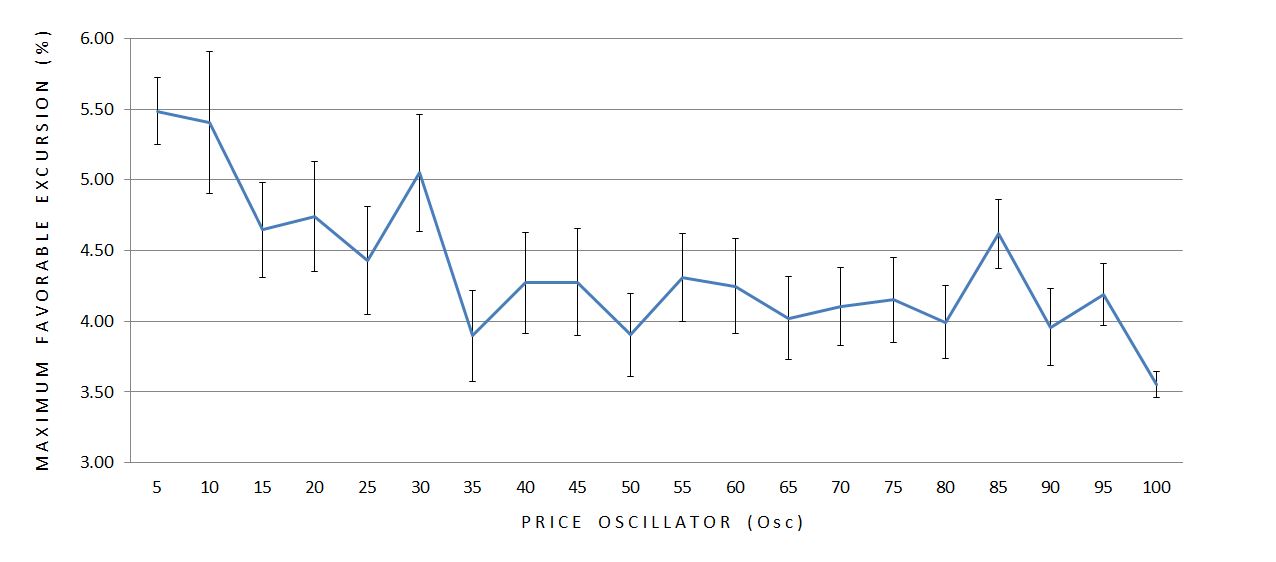
Both ME’s seem to decrease in magnitude as Osc becomes larger.* Furthermore, the variability (SEM) of the data seems to decrease as Osc increases with the exception of the first bar. Sample size is used to calculate SEM so I graphed it:
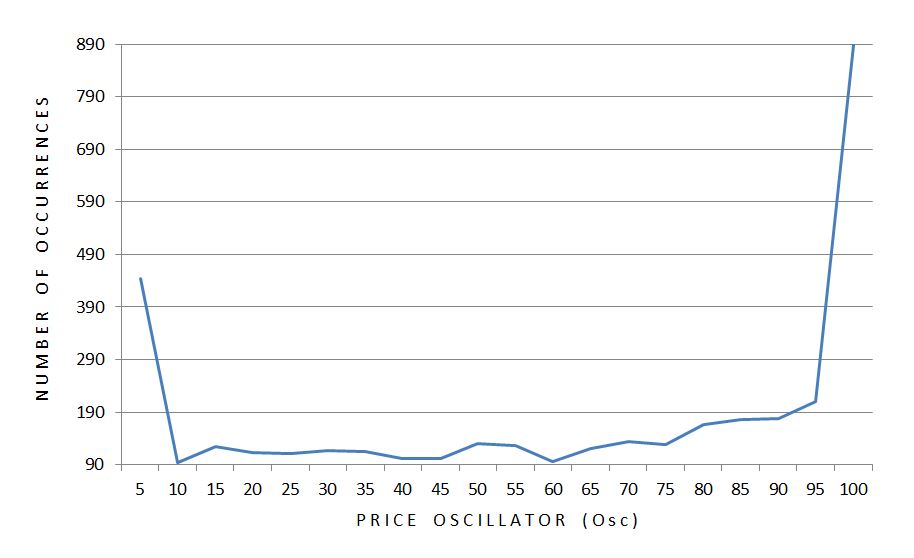
A disproportionate number of occurrences take place at the extremes. Furthermore, twice as many occurrences take place at the high as the low. Sample size could therefore explain why the smallest error bar is seen at the right edge of the graph.
Standard deviation (SD) is a measure of variability that does not correct for sample size. Here is a graph of SD across all 20 ventiles of Osc:
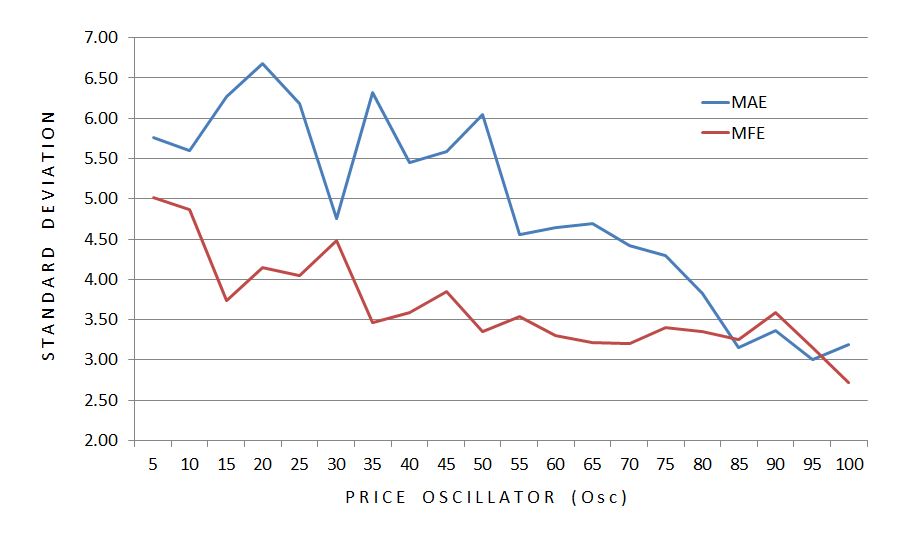
SD makes the case for an inversely proportional relationship between variability and Osc.
The smaller magnitudes of excursion as the market becomes more overbought corroborates the variability finding. Together these paint a picture of greater stability in bull markets.
This is not about trend-following vs. mean-reversion behavior. When the market is down, the larger up moves (MFE) suggest mean reversion but the larger down moves (MAE) suggest trending behavior. When the market is up, the smaller up moves suggest mean reversion but the smaller down moves suggest trending behavior. These are contradictory.
The findings make more sense from a volatility perspective. Implied volatility generally increases as the market sells off. This means larger moves are expected in either direction, which is just what we see.
* –For those interested, a single-factor ANOVA was highly significant for both MAE and MFE (p < 0.0001).