Backtesting Frustration (Part 2)
Posted by Mark on June 29, 2017 at 07:12 | Last modified: March 1, 2017 10:03I left off talking about spreadsheet headers, which really define the whole backtesting project. Today I will continue by discussing some frustrating aspects of the OptionVue (OV) software itself.
Having opened for business in 1983, OV has more tenure in the “high-end options analytics” space than any other company. A more recent newcomer to the space is OptionNET Explorer. ThinkorSwim brokerage also has some backtesting functionality through its thinkBack module.
None of these software packages support automated backtesting. This would be a process by which I could define a trading system/guidelines and have the software automatically process the entire trading interval with an output of results in seconds (e.g. AmiBroker for stock/futures trading systems).
Since a delay is incurred to update the matrix (i.e. options chain) whenever I switch time or date, my approach is to enter a new backtrade on each trading day. To maximize efficiency, I try to monitor/record necessary statistics for each open trade while the data is loaded for that date. This includes PnL and anything else specified by the column headers.
Frustration #1 regards buggy R-codes (see last post), which has gotten worse over the last year’s worth of software updates. Positions displayed in the matrix are shown in the “Ex.Pos Included” field or checked in the pull-down menu:
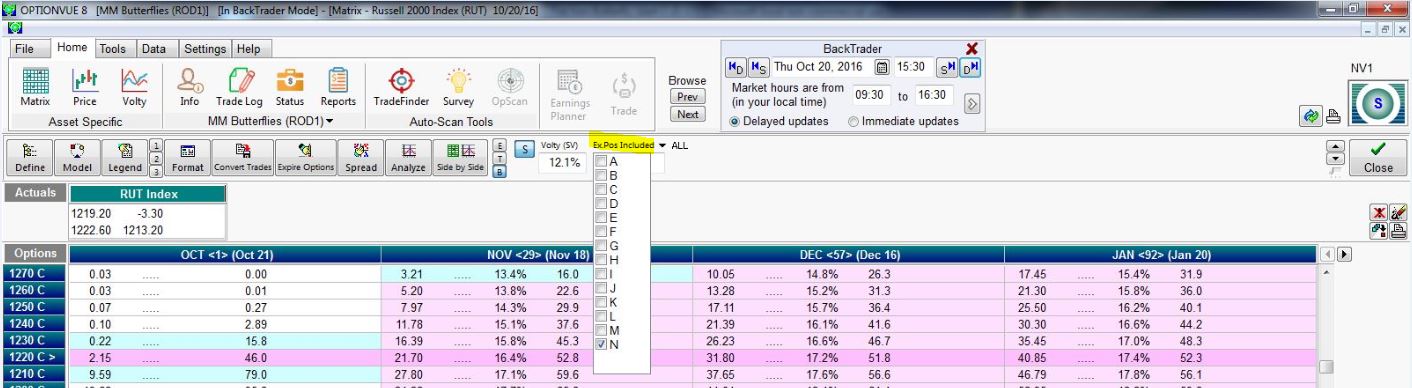
I used to be able to quickly scroll through open trades by typing the corresponding letter, number, or symbol into the Ex.Pos Included field (obstructed in this screenshot by the pull-down). I am now limited to letters and I often have difficulty entering them with keystrokes.
You can also see the “ALL” selection that toggles with “NONE” by clicking on the arrow. The “APPLY” button is only available intermittently and not in the current screenshot. If I try checking select positions, “ALL,” or “NONE” when the button is not available then I cannot move forward.
Issue #2 regards the days to expiration (DTE) calculation. When Backtrader is set to 2001 – 2002, DTE is calculated based on expiration Saturday. As far as I know, these options have always expired on Friday. The software is inconsistent as to when it changes DTE calculation from Saturday-based to Friday-based. When I tested this yesterday it was on 1/3/03. Today it happens on 1/13/03.
Either way, I have to remember whenever I visit the early portion of the database to check DTE in my head for consistency. Sometimes I will forget this for a few historical weeks/months and be forced to go back and modify every DTE number for affected trades. Cue additional frustration.
I will continue next time.
Categories: Backtesting | Comments (0) | PermalinkBacktesting Frustration (Part 1)
Posted by Mark on June 26, 2017 at 07:42 | Last modified: February 27, 2017 10:56On Saturday I started a backtest. I only got through 15 minutes before I quit in frustration. Today I want to explain why this happened and possibly flush out some insightful principles about the backtesting process as a result.
This is going to be a tough blog post to write. I just went for a dark chocolate mint 3 Musketeers bar. If I had candy corn here then I would have grabbed that. My best friends know what this means. Everyone else can probably guess.
I have brainstormed a good 1,200 words on this subject and full explanation of some of these concepts could be a lot lengthier. Some of these are lines of thinking having to do with statistics, trading system development, software, and intraday vs. end-of-day trading. If I can succeed in presenting the material in an organized fashion then at the very least it should be good fodder for discussion. At most it may serve as dynamic teaching material.
My first hassle when it comes to backtesting is how to label spreadsheet columns. What may seem like a simple detail really defines the whole thing. For the next few (to several) months I will be looking for and recording data defined by the column headers. If I get to the end and realize I forgot something critical then I may bang my head because I’ll be looking at months of additional work to go back and gather information rather than a few extra seconds per backtrade when I had the proper information on the screen.
My intent this past Saturday was to backtest a symmetric butterfly strategy. Here were the column headers I chose:

Font too small? Welcome to my world of squinting eyes. If I make it bigger then fewer columns fit on the screen at once and I have to use the scroll bar to enter routine data. Each second this adds gets multiplied by up to 4,000 backtrades, which also gets multiplied by two (back and forth).
Column (“Col”) A is date of trade inception. Col B is a letter code used to identify each day’s trade from all the trades currently in the transaction log. In OptionVue (the software I use) parlance this is called the R-code. Col C is the underlying price, Col D is the average implied volatility for all options in the chain, Col E is days to expiration (DTE), and Col F is the short strike for this position. Col G is the initial margin requirement for this position.
I have covered enough ground to explain some frustrations I have with the software itself. I will pick up here next time.
Categories: Backtesting | Comments (5) | PermalinkButterfly Backtesting Ideas (Part 1)
Posted by Mark on June 12, 2017 at 06:23 | Last modified: February 22, 2017 10:02I have completed one exhaustive butterfly backtest on dynamic iron butterflies (DIBF). While helpful for offering up some context, it left much to be desired.
Butterflies seem to be all the rage in trading communities these days so the main reason my backtest failed to impress is because the results were inconclusive. Slippage really made the difference between a trade that was profitable and one that was not. While tantalizing to think I can overcome slippage by simply entering a GTC limit order and waiting for a fill, unables do occur. Backtesting cannot fully determine the impact of unables primarily due to limited granularity of data (30-minute intervals).
I have some methodological issues that may have negatively impacted the results. The dynamic nature of the strategy means some trades were symmetric and others were asymmetric. An asymmetric butterfly will have a lower max loss potential to the upside. Even though most losses seem to have taken place on the downside, having a much larger upside loss potential (100%) hurts because the downside loss potential is the same either way (100%).
Aside from some trades being symmetric, those that were not had varying degrees of asymmetry. The greater the asymmetry, the lower potential loss to the upside in terms of ROI (%). Perhaps this should be standardized.
The need for standardization feeds directly into the next issue: use of percentages (ROI) instead of PnL. Because margin requirements ranged from $1,401 to $12,400, I used percentages to avoid having to normalize (e.g. two contracts of a $5,000 trade equates to one contract of a $10,000 trade). ROI is unaffected by margin requirements. Now consider a downside loss. Asymmetric and symmetric butterflies can both experience -100% ROIs when PnL is [much] worse for the asymmetric due to the embedded put credit spread. This doesn’t feel right.
One thing I could do with the DIBF backtest is normalize for margin requirement then recalculate the trade statistics based on PnL. This might serve as confirmation that I was on the right track with the initial analysis.
Categories: Backtesting | Comments (0) | PermalinkRolling Naked Puts (Part 2)
Posted by Mark on June 9, 2017 at 07:18 | Last modified: February 21, 2017 10:21Last time I presented some data in an attempt to replicate the Market Measures (MM) episode from November 8, 2016.
The backtesting methodologies are different. MM started with 0.30-delta naked puts. They took assignment at expiration and sold a 0.30-delta call against it. I started with 0.20-delta naked puts and whenever a 3x stop-loss was hit, I rolled out to the next available expiration month.
My reason for rejecting the roll adjustment had to do with the larger max drawdown (DD) and standard deviation (SD) of returns. MM did not present these statistics.
The Tasty Trade mantra “trade small and trade often” alleviates the DD/SD concern. This is an effective means to cover their *ss because no one loss would ever be catastrophic. I feel this works for people trading part-time as a hobby who have an independent paycheck consistently coming in.
I do not believe “trade small and trade often” works for people trading full-time as a business, however. Unless capitalized with millions of dollars, one cannot trade “small” and still be able to cover living expenses. When position sized as a viable business, most traders do not have enough diversified strategies to avoid widespread portfolio devastation should a naked put max DD type of event occur. This is why I believe max DD and SD of returns are necessary to design a workable trading plan.
My backtest included 509 trades that hit a 3x stop-loss but excluded an additional 376 trades that hit the 2x stop-loss level. Naked puts that lose on the roll are those where the market does not recover or continues to tank lower. These are the most severe losses and are included in the present backtest. Backtesting trades hitting the 2x stop-loss that do not go on to hit 3x would therefore probably improve overall results.
I do not believe inclusion of the 2x stop-loss trades would be enough to save the rolling strategy, however. While I would expect to see more than a 15% improvement, even if PnL improves by up to 50% (for example), the 4x larger max DD realized when rolling would necessitate a decrease in position size by 80% to equate the DD’s and 80% >> 50%.
Categories: Backtesting | Comments (0) | PermalinkRolling Naked Puts (Part 1)
Posted by Mark on June 6, 2017 at 06:48 | Last modified: February 20, 2017 09:42The motivation for this study comes from the Market Measures (MM) episode discussed here. Is rolling naked put losers a viable strategy for improving trade results?
Here are some important details from my study:
- All trading was done at 3:30 PM
- Used first strike with delta < 0.20
- Rolled put to next available expiration when 3x stop-loss hit
- Closed puts on expiration Thursday
- All trades subject to a $0.26/contract transaction fee
Here’s what I found:
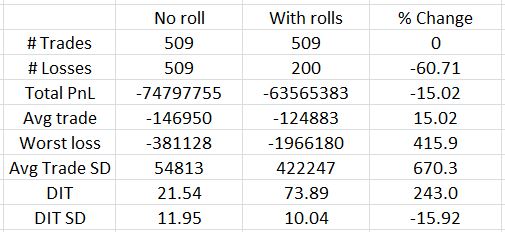
Out of 509 trades, only 200 lose on the roll. This represents a 60% reduction in number of losers as shown in the third column. Rolling reduces net loss by about 15% and the average trade improves on the roll by the same amount (rows 4-5). That is the good news.
Bad news starts with row 6: the worst loss increases by over 400% with rolling. The standard deviation (SD) of trade results also increases over 650%. I have discussed many times how maximum drawdown (DD) and SD both represent risk (e.g. here, here, and here). If I position size based on max DD then I would have to trade five times smaller with rolling than without. A 15% improvement in PnL is hardly going to compensate for that.
Days in trade (DIT) is obviously larger with the roll. It more than triples, though, and this will dilute the PnL improvement. Three non-rolling trades could be done in the roughly 74 days it would take for one rolling trade. With a win rate over 84%, odds are the sum of three trades will better the PnL of the rolled trade.
Looking back to the MM presentation, the biggest difference between my analysis and theirs is what they did not present. I have detailed this critique elsewhere. Like the MM episode, I looked at success rate, average PnL, and DIT. I also discussed max DD and SD of results, though, where MM did not. As it turns out, these are the statistics I find to be most decisive and they are the biggest reason I believe rolling is not viable. MM arrived at the opposite conclusion.
I don’t believe the full picture of rolling can be understood without analysis of max DD and PnL SD. Without them you may be headed for an awful surprise when max rolling DD is experienced with real money! That would not make for a pleasant day.
I will continue next time.
Categories: Backtesting | Comments (1) | PermalinkProfessional Performance (Part 2)
Posted by Mark on June 1, 2017 at 06:30 | Last modified: February 16, 2017 14:25Last time I discussed management of other people’s money. Today I want to focus on my recent trading performance.
On September 21, 2015, I began trading my personal account very similar to the way I would professionally manage money for others. I have traded every single day while adhering to a defined set of guidelines for opening trades. The little flexibility I have maintained with regard to position sizing and closing trades would be omitted as a professional money manager. Rather than using discretion, if someone wanted to squeeze out more return then I would discuss the possibility of a larger portfolio allocation to my services.
Here is a graph of net ROI from 9/21/15 through the end of 2016:
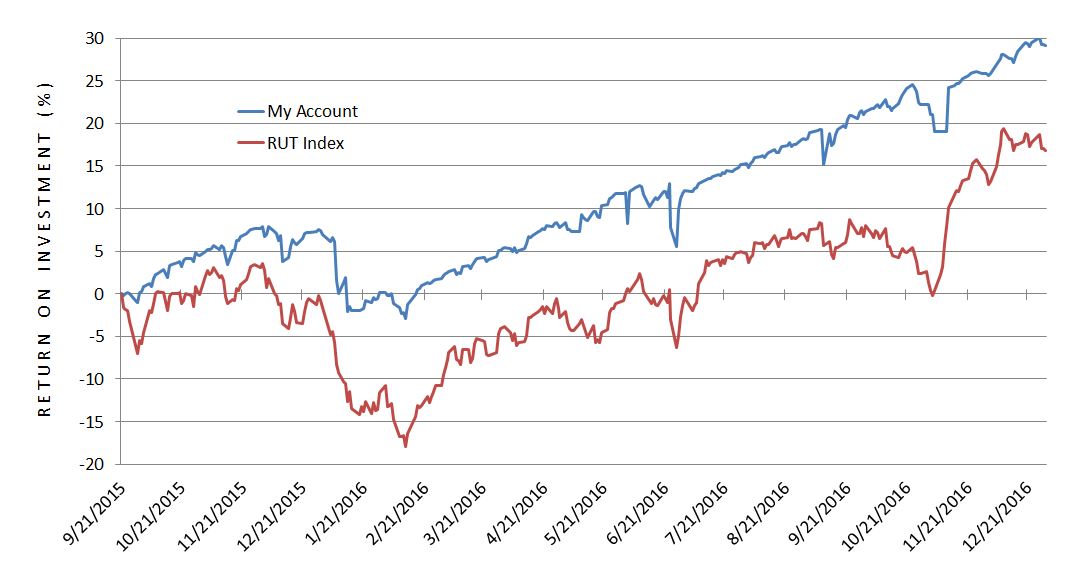
Over 15+ months, I have outperformed the index 29.2% to 16.8%.
Here is a graph of maximum drawdown (DD):
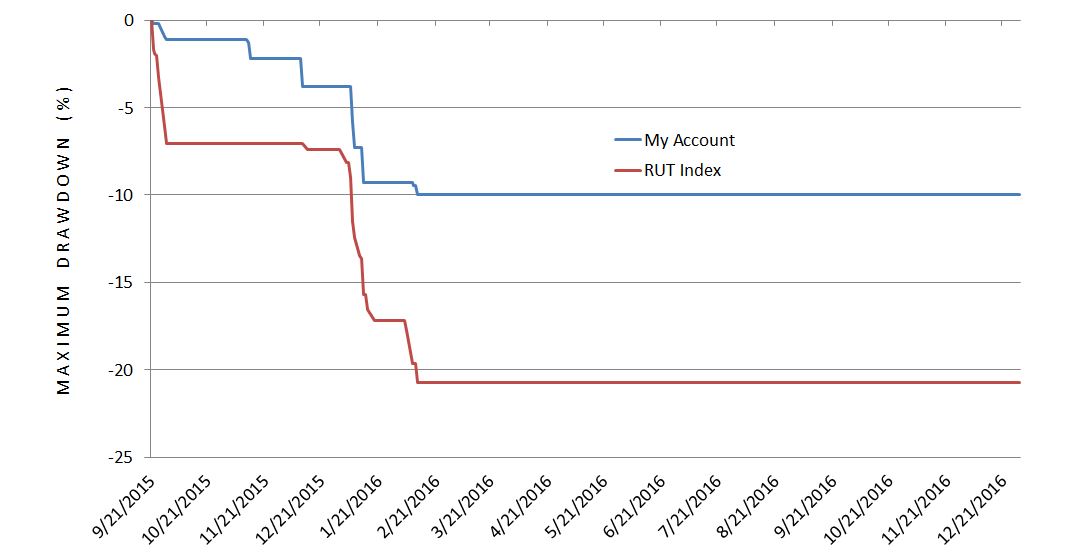
In addition to a larger total return, my max DD was smaller than the index: -10.0% vs. -20.7%. February 2016 offered a moderate market pullback and my ability to keep DD in check resulted in a 3.6x better risk-adjusted return (ROI divided by max DD): 2.92 vs. 0.81.
Because ROI and max DD are both a function of position size, I graphed daily portfolio margin requirement (PMR) as a percentage of account value:
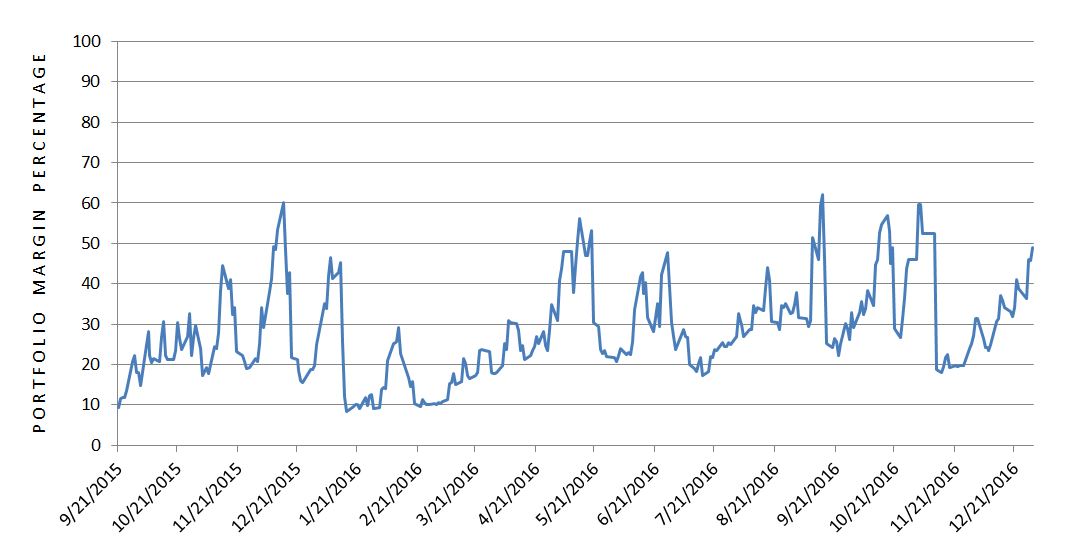
PMR ranged from 8.27% to 62.2% with an average (mean) of 28.6% (standard deviation 11.9%).
Categories: Option Trading | Comments (0) | Permalink