Professional Performance (Part 2)
Posted by Mark on June 1, 2017 at 06:30 | Last modified: February 16, 2017 14:25Last time I discussed management of other people’s money. Today I want to focus on my recent trading performance.
On September 21, 2015, I began trading my personal account very similar to the way I would professionally manage money for others. I have traded every single day while adhering to a defined set of guidelines for opening trades. The little flexibility I have maintained with regard to position sizing and closing trades would be omitted as a professional money manager. Rather than using discretion, if someone wanted to squeeze out more return then I would discuss the possibility of a larger portfolio allocation to my services.
Here is a graph of net ROI from 9/21/15 through the end of 2016:
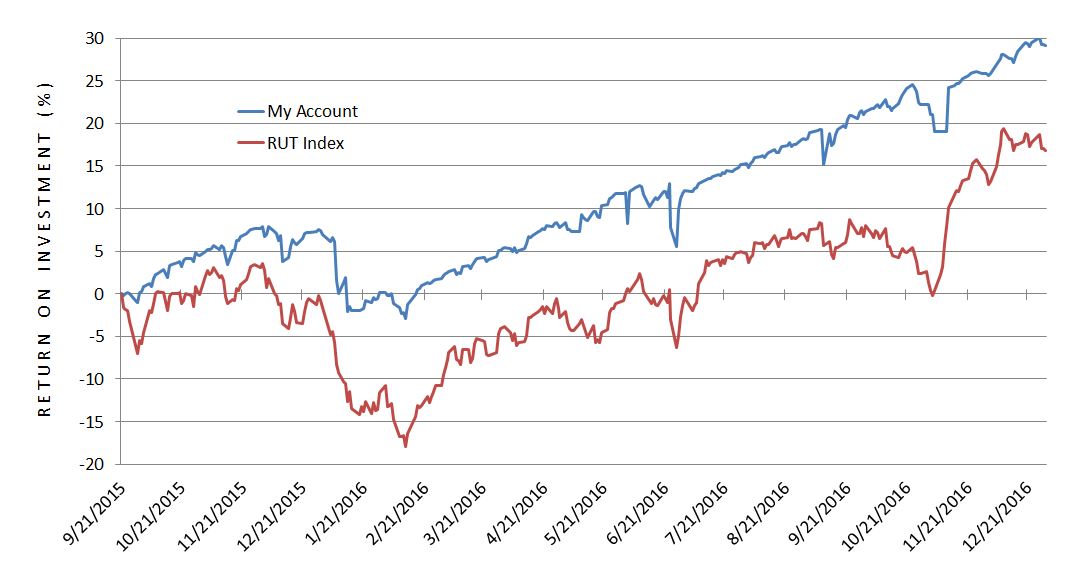
Over 15+ months, I have outperformed the index 29.2% to 16.8%.
Here is a graph of maximum drawdown (DD):
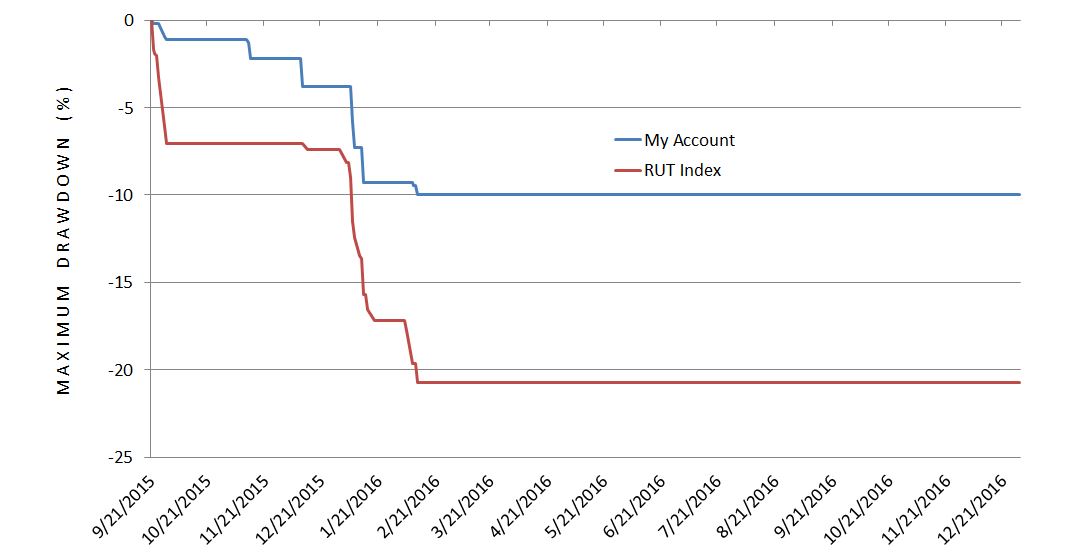
In addition to a larger total return, my max DD was smaller than the index: -10.0% vs. -20.7%. February 2016 offered a moderate market pullback and my ability to keep DD in check resulted in a 3.6x better risk-adjusted return (ROI divided by max DD): 2.92 vs. 0.81.
Because ROI and max DD are both a function of position size, I graphed daily portfolio margin requirement (PMR) as a percentage of account value:
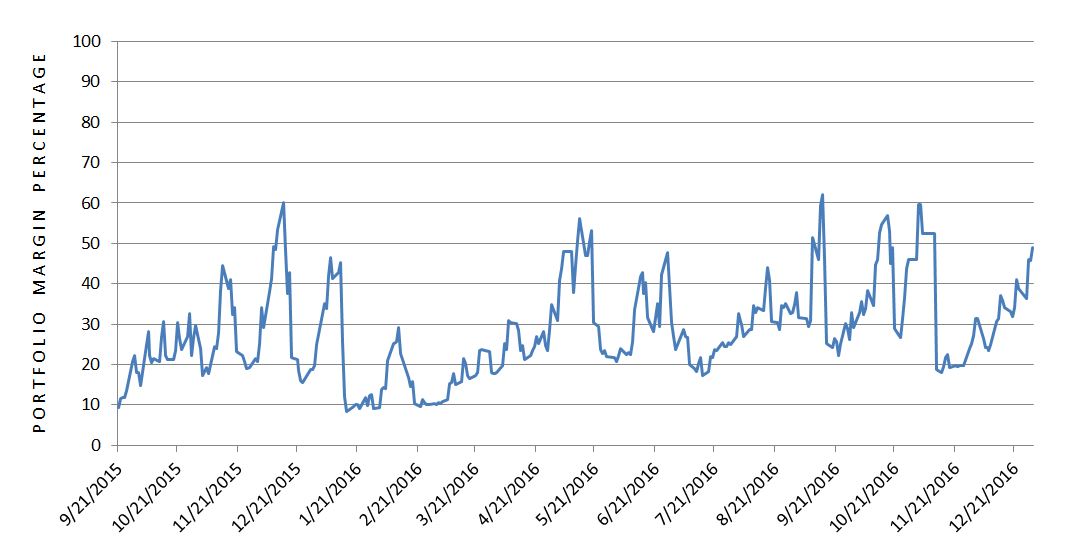
PMR ranged from 8.27% to 62.2% with an average (mean) of 28.6% (standard deviation 11.9%).