Musings on Naked Puts in Retirement Accounts (Part 4)
Posted by Mark on July 27, 2017 at 07:05 | Last modified: October 14, 2017 07:21If a vertical spread lowers the standard deviation (SD) of returns and max drawdown (DD) compared to a naked put (NP) then its résumé is bolstered as an alternative candidate for retirement accounts. This was an unlikely result in the first example studied.
Rather than quintupling position size for the vertical spread, what if I double it? The potential return would be $4 (rather than $10), which is a 33% increase over the NP. The NP risk is now cut by 80% (rather than 50%) to $20K, which is the breakeven for both trades.
The risk graph now looks like this:
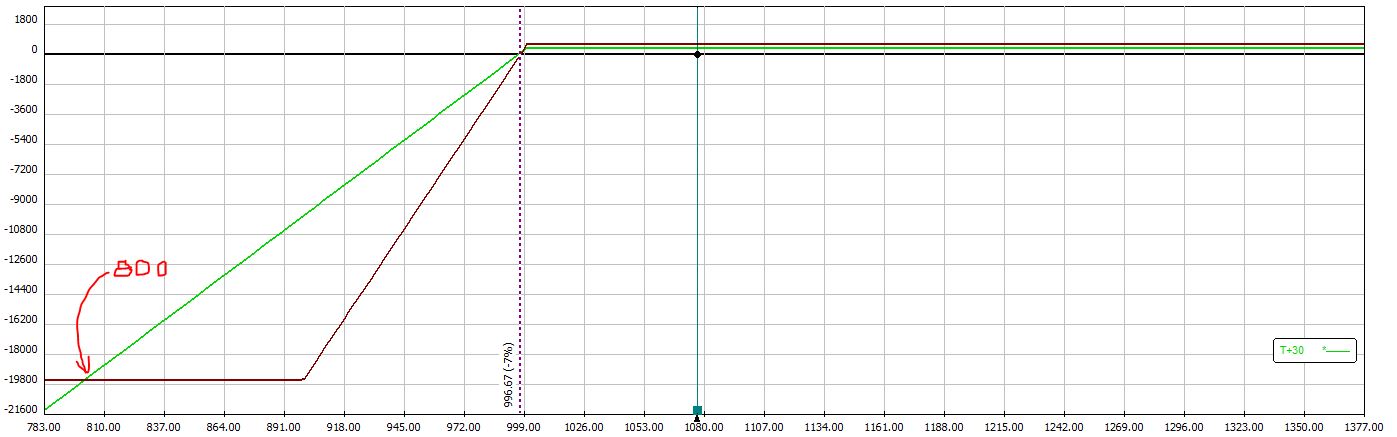
Like the previous example, the vertical spread outperforms if the market rises or if the market falls less than 7%. If the market falls between 7% and 20% then the naked put outperforms. If the market falls more than 20% then the vertical spread outperforms. A market correction over 20% is more likely than a market correction over 50% and this is where the risk metrics (SD of returns and max DD) would be improved by the vertical spread.
Of course, the vertical spread could be traded in equal position size to the NP. This would generate the first graph shown in Part 3. In that case, no gap of underperformance exists for the vertical spread and any market correction over 10% would generate better risk metrics for the vertical spread.
So going back to my statement in Part 1, does the vertical spread actually improve risk metrics?
The largest market crashes (e.g. fall 2008) will give rise to a lower SD of returns and a lower max DD for vertical spreads.
Unfortunately, these severe crashes occur so rarely that it’s hard to plan a trading strategy around them. The vertical spreads may or may not yield improved risk metrics depending on whether the market corrects, how often it corrects, and the exact magnitude of corrections during the time interval studied.
Compared to NP’s, vertical spreads may improve risk metrics. This is far from guaranteed.
Categories: Financial Literacy | Comments (0) | PermalinkMusings on Naked Puts in Retirement Accounts (Part 3)
Posted by Mark on July 24, 2017 at 06:27 | Last modified: April 5, 2017 13:53Today I resume discussion of vertical spreads instead of naked puts (NP) in retirement accounts. I mentioned previously that [OTM] vertical spreads don’t usually affect standard deviation (SD) of returns or maximum drawdown (DD). In case of a significant market downturn, however, they certainly can.
Let’s begin with the risk graph comparison posted earlier:
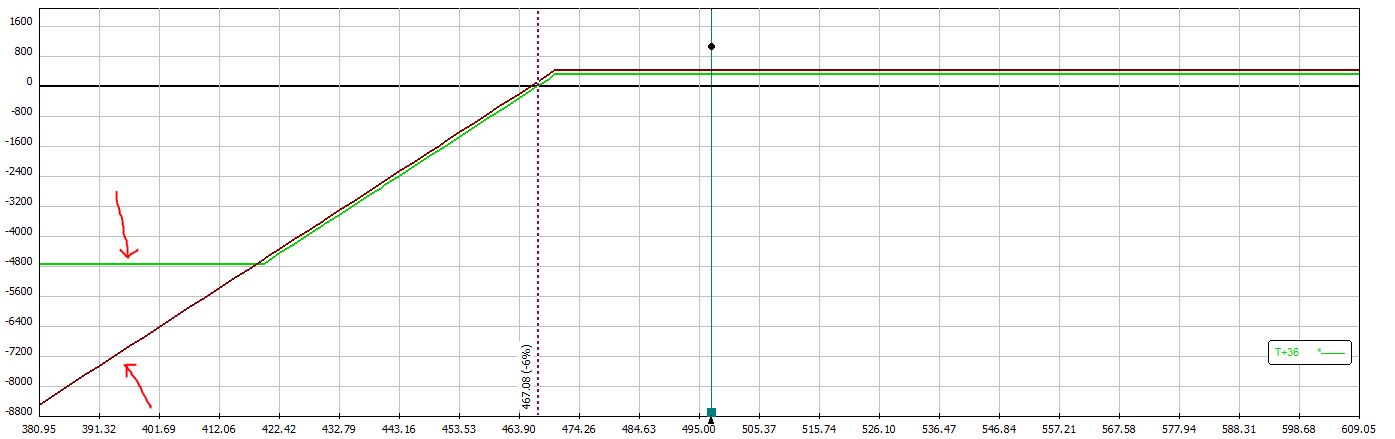
Notice how the green line (vertical spread at expiration) goes horizontal once the market drops ~16% to 419. That is where max loss is hit. The farther the market drops beyond that point, the more the NP (purple line) loses relative to the vertical spread. This represents a lower SD of returns and a lower max DD for the outperforming vertical spread.
This analysis assumes equal position size and offers an important distinction between ROI and gross PnL. In percentage terms, the vertical spread loses more than the NP if market falls the 16%: 100% for the vertical spread versus [under] 16% [buffered by initial premium collected] for the NP. In terms of gross dollars, the NP and vertical spread lose similar amounts until the vertical spread has lost 100% at which point the NP continues to lose more. 16% is the loss threshold beyond which the vertical spread delivers a lower SD of returns and a lower max DD than the NP.
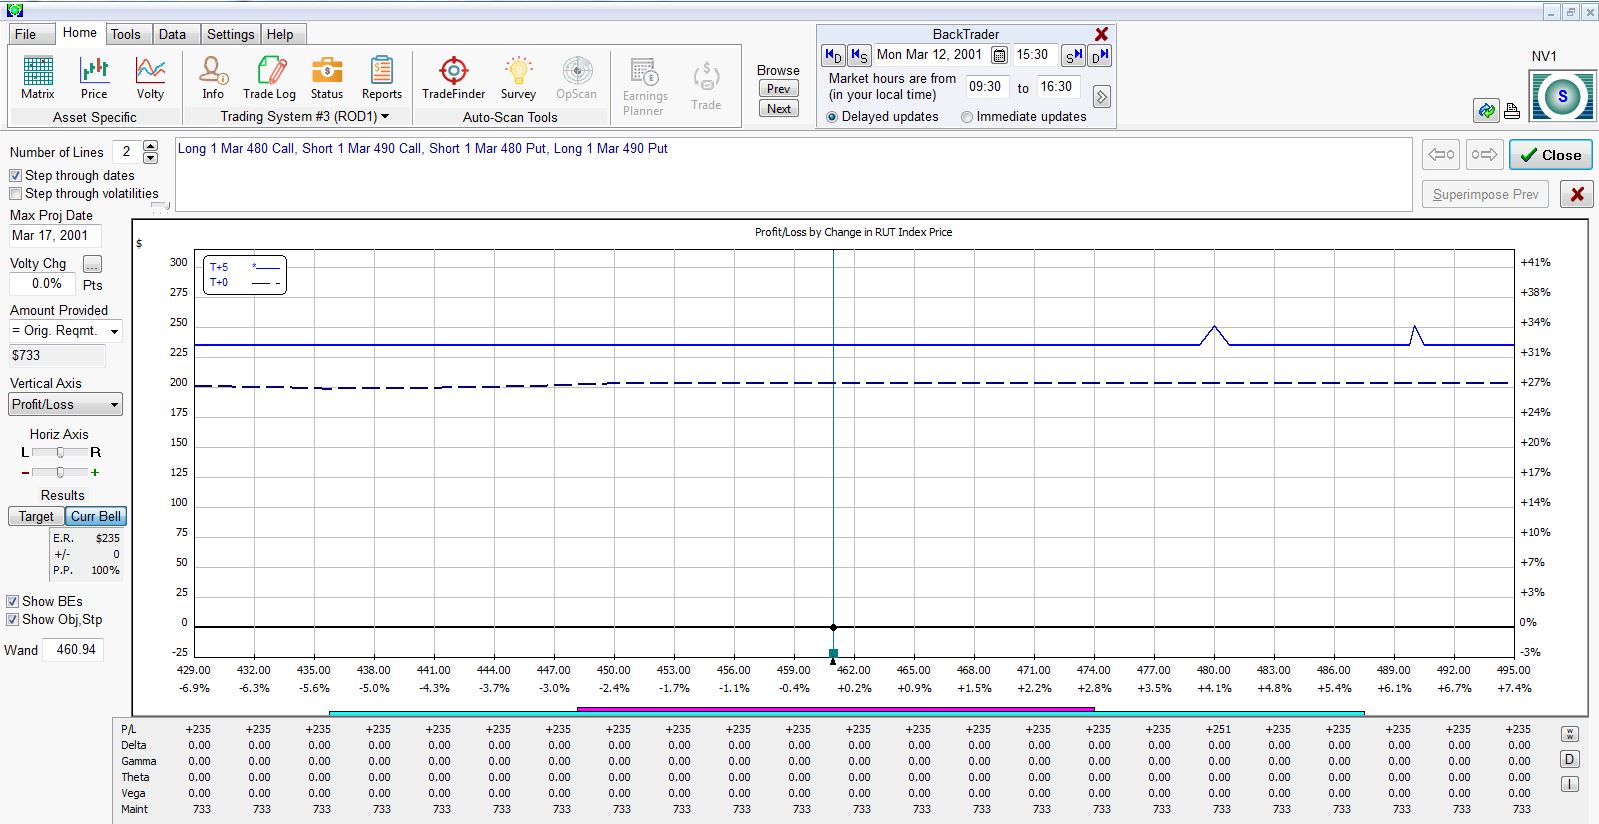
Now let’s reconsider the naked 1000 put example I presented here. If I sell a 1000 put for $3.00 then [gross] risk is $100,000. If I buy the 900 put for $1.00 then I cut risk by 90%. I could, therefore, trade five times as many verticals while still halving the NP risk. Potential ROI on the vertical spread would be 6.7-fold greater.
Here are the risk graphs of the vertical spread (red line) and NP (blue line):
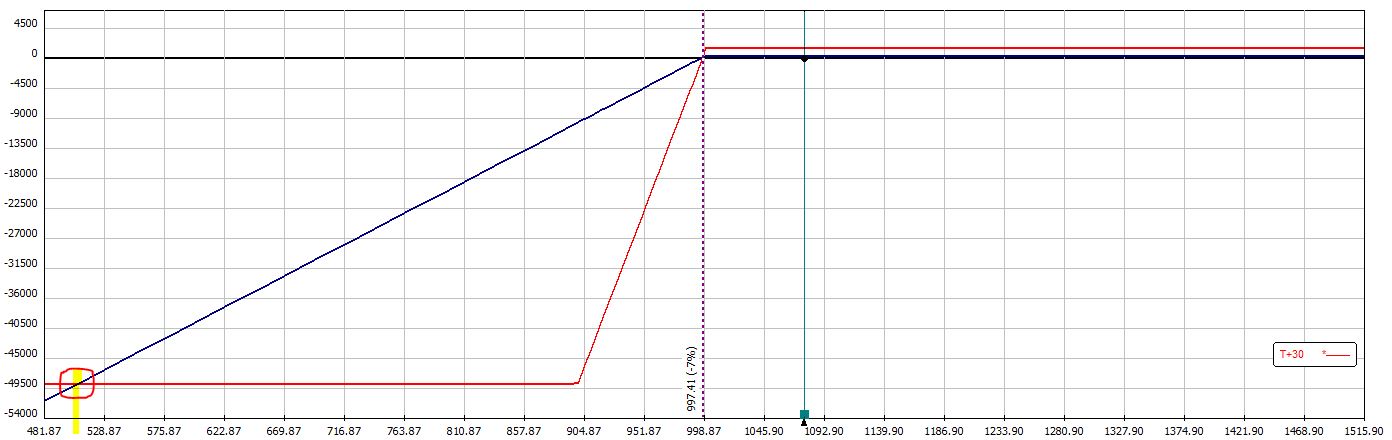
The problem with the vertical spread is the possibility of losing the entire $50K should the market fall from 1000 to 900 (10%). For the NP to lose $50K the market would have to fall to 500 (50%), which is circled in red. In this case, the vertical spread outperforms if the market rises or if the market falls less than 7%. If the market falls between 7% and 50% then the NP outperforms. If the market falls more than 50% then the vertical spread outperforms.
Because a fall over 50% is so unlikely, this particular vertical spread position would probably post a larger SD of returns and a larger max DD than the NP were the market to enter a meaningful correction.
In the next post I will compare a different vertical spread position to see how it measures up.
Categories: Financial Literacy | Comments (1) | PermalinkEnd-of-Day Versus Intraday Trading (Part 2)
Posted by Mark on July 21, 2017 at 06:24 | Last modified: March 28, 2017 14:58As I mentioned last time, a big part of the debate between end-of-day (EOD) and intraday trading involves the difference between the probabilities of touching and expiring. The markets are often regarded as random (Brownian motion). When a particular price level is reached, the market then has a 50/50 chance of moving higher or moving lower. The probability of expiring beyond that level is therefore less than the probability of touching it.
For intraday trading, this may be both an advantage and disadvantage. More winners can be exited intraday, which is an advantage. More losers—some of which would otherwise go on to be winners—will also be exited intraday, which is a disadvantage. On trend days, exiting losers (winners) intraday will avoid (preclude) what could otherwise be larger EOD losses (profits), which is an advantage (disadvantage).
This debate is not getting any easier.
Price action aside, another disadvantage to intraday trading is the need to be available and/or take action more than once and possibly whenever the market is open. This takes a lot of flexibility out of the workday.
The biggest disadvantage to intraday trading is arguably a much more complex (or impossible) backtesting proposition. OptionVue (OV) provides data every half hour. If I am going to “trade like I backtest” (mentioned here and here) then I must monitor trades every 30 minutes. Such backtesting would more than quintuple my current 2-5 months per backtest. Continuous market monitoring represents another magnitude of complexity because significant volatility can occur even between 30-minute prints. Backtesting this trading time frame would therefore require a much more granular database.*
As a net seller of option premium, I find time decay to be more certain than typical [random] price action. Every 24 hours an option gets one day closer to expiration. Implied volatility increase can offset time decay in the short-term but this only happens in some instances of down markets, which is [significantly] less than 50% of the time.
Given this additional reasoning, my gut instinct is to give the nod to EOD over intraday trading. A trade is more likely to be exited at an intraday stop-loss for the additional reason that option decay into the close may improve the PnL. Being directionally long also favors EOD trading by giving more time to allow for positive drift. The observations that many trades have small MAEs and only a select few have huge MAEs is additional evidence in favor of longer trade duration (EOD).
For me, the exponential complexity or impossibility of backtesting is the proverbial nail in the coffin for intraday trading. These restrictions actually make me wonder whether the perceived benefit of enhanced intraday opportunity is more illusion than anything else.
* – Any discretionary strategy that uses alerts to signal entries, exits, or adjustments implies this sort of intraday, continuous-monitoring approach.
Categories: Financial Literacy | Comments (1) | PermalinkEnd-Of-Day Versus Intraday Trading (Part 1)
Posted by Mark on July 18, 2017 at 06:57 | Last modified: March 6, 2017 08:13One thing that came to mind from my recent blog series on backtesting frustration was the distinction between end-of-day (EOD) and intraday trading.
The most important aspect of EOD trading for me is once daily. This is much different from intraday trading where I could be watching the market continuously. For the sake of this discussion I will assume EOD takes place at the close but I really feel the exact time is arbitrary as long as it is consistent (e.g. 10:30 AM, 3:35 PM, etc.).
EOD trading has pluses and minuses. Checking in on the market once daily is a plus. This makes for a very flexible work schedule. Another plus is the opportunity to realize windfall profits in excess of my target. On the other hand, I believe the biggest minus is the potential to realize windfall losses. If the loss at trading time is beyond my stop then I must take it no matter how bad it is.
One advantage of intraday trading is a greater opportunity to exit trades at a price target. This is because the probability of touching a certain profit level exceeds the probability of closing at that level. Suppose I am up 8% on a long stock trade with a 10% profit target. A small amount of market volatility the next day will likely push the trade to +10%. To close at +10%, though, the market has to have an up day. In this case I would not be able to capitalize on so many of the choppy days where the market is higher intraday before closing lower.
Another advantage to intraday trading is the opportunity to realize tighter stops. Suppose my trade with a 15% stop-loss closed down 14% yesterday. As an EOD trader, should the downtrend continue today then who knows how far beyond -15% the trade might be when I have to exit at the close? Were I trading intraday, I could likely exit much closer to that -15%.
This is also a disadvantage to intraday trading, however. I may sometimes get stopped out for a loss on trades that briefly fall below my stop only to see them reverse higher as they ride off into the sunset without me, never looking back.
EOD or intraday? This is a tough, tough deliberation.
I will continue next time.
Categories: Financial Literacy | Comments (1) | PermalinkBacktesting Frustration (Part 6)
Posted by Mark on July 13, 2017 at 05:46 | Last modified: March 5, 2017 09:10This has been a very beneficial exercise in expository writing because at the outset I was not sure I would ever get through. One question remains: why bother backtesting 2001 – 2003 if this part of the database has so many holes?
2001 – 2003 presents a critical sampling of different market environments. The 9/11 crash is followed by a sharp bullish reversal into January 2002. From April 2002 to July 2002 the market fell 29% before falling 20% from August 2002 to October 2002. The market then rallied 63% from March 2003 through December 2003. These may be the only occurrences in the database of such wide-ranging action at low market prices. And even if they weren’t the only occurrences, the total number of occurrences is small enough to make each one critically important.
I feel better having gotten all of this frustration out in writing.
With regard to the abandoned butterfly backtest, I think I will simply the column headers and take it a smaller chunk at a time. As mentioned earlier, I am trying to accept that my backtesting will take much longer than it probably should. This will be one of those cases but at least it will get done and hopefully from it I will get some very insightful analysis.
Categories: Backtesting | Comments (0) | PermalinkBacktesting Frustration (Part 5)
Posted by Mark on July 10, 2017 at 07:10 | Last modified: March 5, 2017 08:40Given everything I said about spotty/flawed data, and the occasional need to manually add additional strike prices, starting later would probably be better. This presents another set of backtesting problems that I will discuss today.
Starting the backtest where I know the database is more complete (e.g. 2005) would result in fewer workarounds, fewer holdups, and faster overall progress. By shifting the hardest work to the end, this would serve as an effective antidote for much of the frustration I have been discussing in this blog mini-series.
Unfortunately, in order to generate an equity curve I need to start at the beginning. The process records account value every trading day to allow any errors to be immediately identified and fixed, which preserves integrity of the curve. Also as a cumulative summation to date, an equity curve does not even make sense without all previous trades being logged.
In order to get through, I have just been trying to accept that the research will take much longer than it probably should. I go through the 16-year database once to perform the backtrades. I then go through the database again to record equity values. I can’t do it all together when my attention is split in so many different directions trying to keep up with what statistics to record (dictated by the column headers), filling in missing data, and sometimes reviewing for data accuracy. The harsh reality is that a second time through can easily add 2-4 weeks on top of what has already been 2-4 months.
Backtesting stop-losses presents a similar conundrum. This is what inspired the current blog series after frustration forced me to abandon my last butterfly backtest. I tried to include stops in the column headers so I could watch for them every trading day. I was monitoring two profit targets, two stop-loss levels, and MAEs for multiple open trades in a spotty portion of the database. My cognitive capability was simply overwhelmed.
One could argue the most accurate way to collect stop-loss information is to first record MAE for all backtrades and then filter by different stop levels (e.g. 1x, 2x, 3x) to later go back and retest only those trades reaching the different levels to determine the actual end-of-day losses.
While it may be accurate, it certainly is not efficient or fast. I hope OptionVue can help me more with that as time goes by.
Categories: Backtesting | Comments (1) | PermalinkBacktesting Frustration (Part 4)
Posted by Mark on July 7, 2017 at 06:48 | Last modified: March 3, 2017 05:17Today I continue to hack my way through this difficult exercise of putting into words exactly why I sometimes find backtesting to be paralyzingly frustrating.
And yes, that really is a word:
(sorry but some periodic comic relief along with that candy are what it’s taking to get me through a subject like this)
Flawed data decreases backtesting accuracy by an indeterminate amount. I do not realize the data is flawed so I don’t know how often errors occur, to what extent, and therefore how large the impact. The reason I don’t routinely screen for inconsistencies is because a backtest is usually thousands of trades that will already take months to complete. Scrutinizing every historical day would take much longer. Besides, I shouldn’t have to do this. I pay a lot for OptionVue (OV) because I trust they offer a valuable tool. If I cannot trust the data then what good is the software?
In addition to being occasionally flawed, the OV data is spotty at times (especially 2001 – 2003). Missing data must be filled in with theoretical prices (less accurate) but when theoreticals are not available I have to enter prices manually based on a logical vertical volatility skew. This adds 2-3 minutes per historical day.
I also have to deal with insufficient strike availability. Consider below with the underlying at $460:
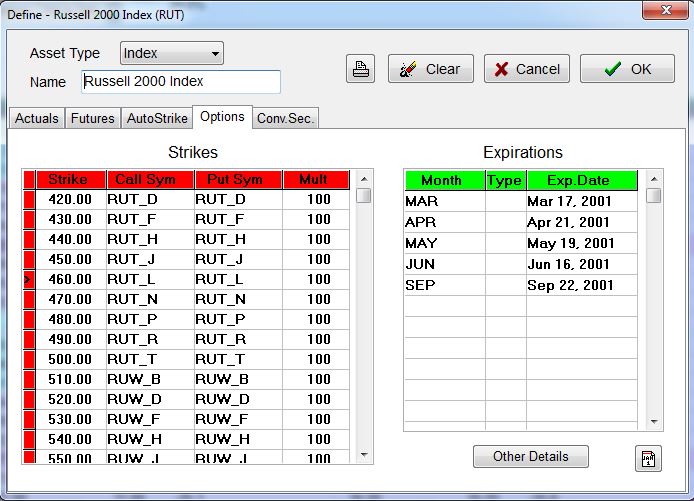
My backtest will require options down to 410 and sometimes 380. When I manually add these:
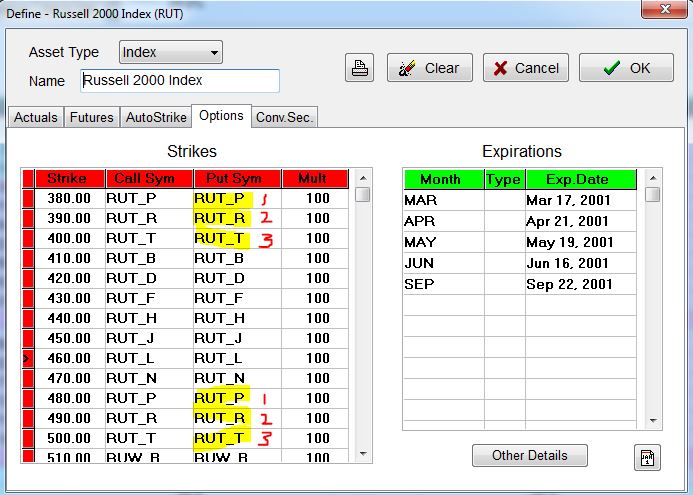
OV automatically duplicates root symbols (see red numbers), which results in flawed (duplicated) option prices:
So when forced to add strikes manually, I need to fill in with root symbols that I may not know. Sometimes I jump to a portion of the database I feel confident will have options in that range to determine the correct letters. For example, if I need strikes in the 300s then I can try jumping ahead to September 2001 where the underlying fell into the 300s to find out what letters were used. Once entered, I have to turn off the “Auto Strike” feature to prevent OV from resetting the matrix (automatically done on the first trading day of every week), which would thereby delete the additional work I have done—additional work that takes minutes, by the way.
And realize this problem is all secondary to the primary issue of an incomplete database.
I mentioned above that a backtest usually includes thousands of trades. You can imagine how tremendously frustrating it is to be repeatedly slowed down like this.
Categories: Backtesting | Comments (1) | PermalinkBacktesting Frustration (Part 3)
Posted by Mark on July 3, 2017 at 06:14 | Last modified: March 1, 2017 10:36Today I will continue discussing backtesting frustration specific to the OptionVue (OV) software.
My third issue is difficulty obtaining accurate margin requirements (MR). The Status window is an excellent piece of functionality that shows, at a glance, desired statistics for all open trades. Only sometimes do I get an accurate MR here, though. Technical support has told me that margin in OV pertains to short options. Debit trades, like the butterfly, do not necessarily have an associated MR. That does not explain why it intermittently works for me, though.
Rather than carving out certain types of positions on which to calculate margin, my preference would be a renaming to something like “buying power reduction” (BPR). All trades reduce buying power and if BPR exceeds the value of my account then I get a margin call: plain and simple. Knowing the BPR will allow me to calculate ROI, which I sometimes like to do.
Another suggestion is a more continuous tracking of MR throughout the course of the trade. At any given time, OptionNET Explorer—another software package in the options analytics space—displays two MRs: current cost and the maximum margin ever recorded. This would be useful to know because while trades have varying levels of margin, holding the maximum margin ever required on the sidelines offers a better chance of maintaining every trade to completion. I believe ROI should be calculated on maximum margin for the same reason. ROI will be diluted since most trades will not reach maximum MR but in live trading, it would be reckless to position size without having full reserve capital available for a worst-case scenario that will happen given a long enough investing horizon.
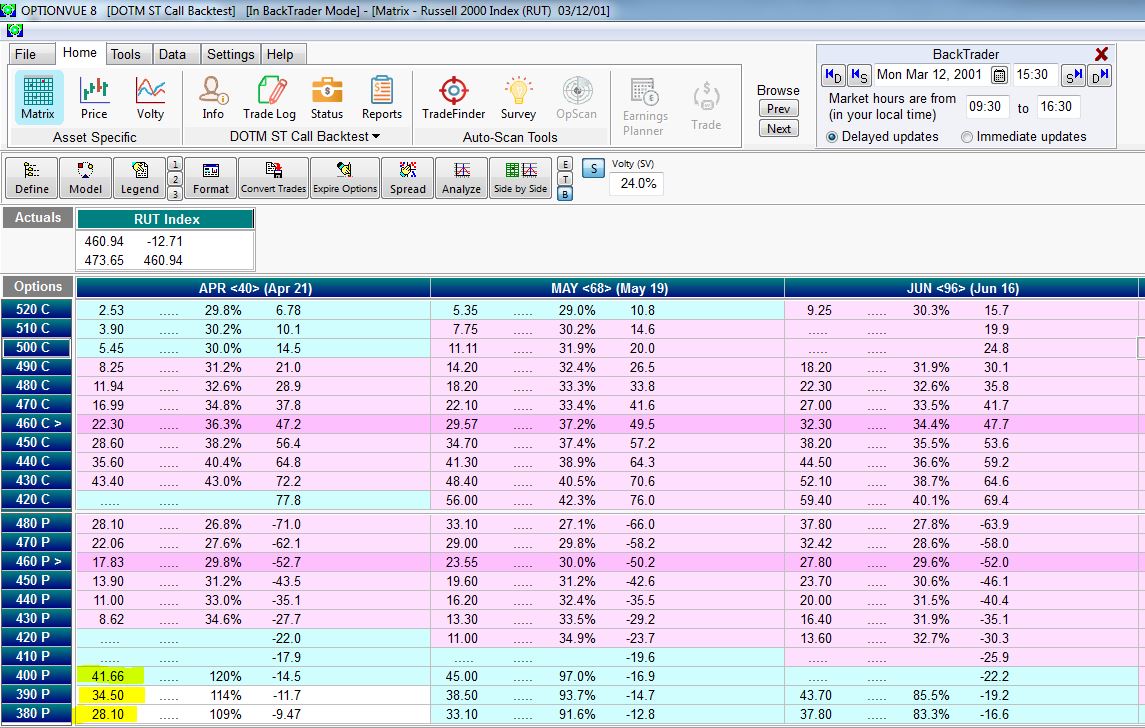
OV issue #4 is truly paralyzing for me at times: flawed and inconsistent price data. I have found the latter portion of the database to be pretty reliable. My concern is chiefly 2001 – 2004. Check out the following matrix screenshot:
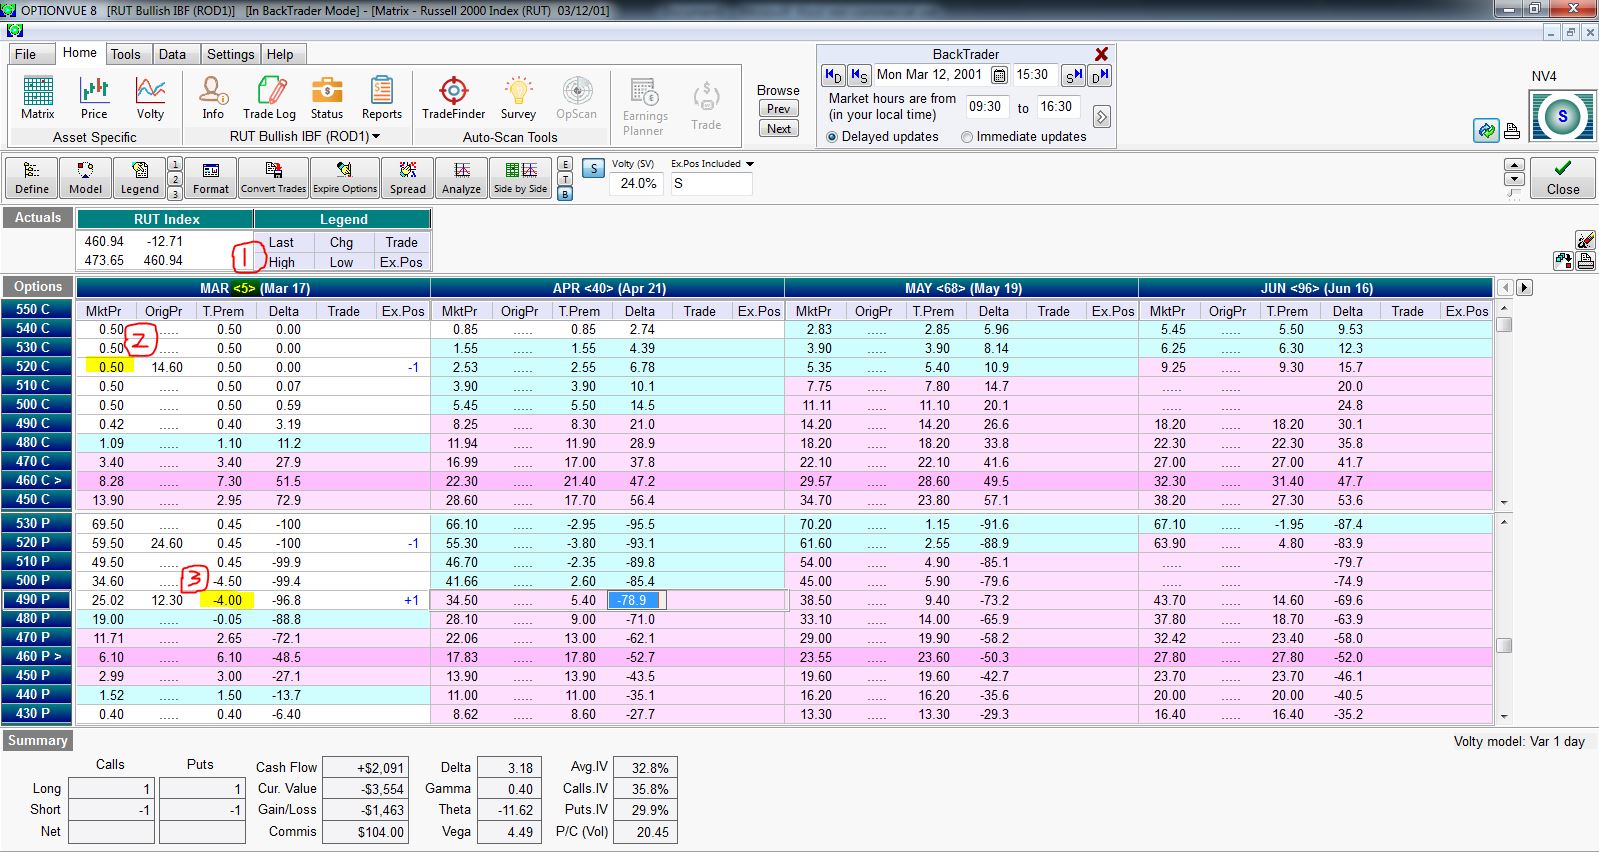
I have highlighted three problems in this matrix:
(1) has to do with the DTE calculation (five days shown for this expiration Monday), which I discussed last time.
(2) refers to the fact that the 500 – 540 calls are all priced at $0.50. This is bogus. Pouring salt on the wound is the fact that the 490 call is priced even lower. If this were ever true then the 490 would be bought and any/all of the 500 – 540 calls would be sold for a guaranteed profit until the price discrepancy went away.
(3) shows the 490 put with -$4.00 of time premium. If that doesn’t make sense to you (it didn’t to me) then recognize the option is ~29 points in the money and priced ~$25. If this were ever true then I could trade a box spread (bull put and bear call vertical spreads at the same strikes) for a guaranteed profit:
As some guru used to say, if trading were that easy then it would be called winning.
I will continue next time.
Categories: Backtesting | Comments (0) | Permalink