Professional Performance (Part 1)
Posted by Mark on May 30, 2017 at 06:52 | Last modified: February 16, 2017 11:20A couple months ago I did a long-awaited performance update. Today I want to focus on the last part of that record.
Over the last few years, I have contemplated the idea of trading for others. The main thing holding me back is doubt that others will find me credible. I consider myself an industry outsider (i.e. have never worked for a financial firm) and I don’t have an official track record.
One way to generate an official track record would be to create an incubator fund. My understanding is trading the incubator fund would be no different from what I currently do except that it would be audited by an expensive accountant. An accountant with a solid reputation may leave the performance record with more credibility.
Then I read posts like this and get really discouraged:
> Unfortunately with hedge funds, you cannot
> use any track record from a previous fund
> or personal trading (even if audited). So if
> you are a famous fund manager you will raise
> all you want off your reputation because
> everyone is aware of the returns you have
> generated in the past—returns that cannot
> be used to market the new fund. With regard
> to an audit, the minimum cost of a respected
> firm is $30K per year. It is supposedly
> expensive because of their liability. But it
> would be a waste of time anyway because
> institutions don’t pay attention to funds
> smaller than $40M. Even the funds of funds
> looking to invest in small time start-ups
> don’t even peek if you’re under $10M. So it’s
> completely on you to impress others enough
> to raise the initial millions and start building
> that track record. Start-ups with little capital
> face those headwinds of large audit/tax/legal
> expenses. If you don’t have “friends and family”
> willing to contribute based on their years of
> knowing you then your only hope is to
> outperform most other hedge funds out there,
> which is not easy to do.
Does this guy know what he’s talking about? I really don’t know but it does not sound encouraging.
I will continue next time.
Categories: Option Trading | Comments (2) | PermalinkMusings on Naked Puts in Retirement Accounts (Part 2)
Posted by Mark on May 26, 2017 at 06:25 | Last modified: October 14, 2017 07:21Today I want to continue the comparison between vertical spreads and naked puts (NP) to better understand the pros/cons when traded in retirement accounts.
Employing leverage makes for a more compelling IRA strategy but a very clear and present danger exists. Look at the graph shown in the previous post. At expiration, a 100% loss on the vertical spread will be incurred if the market falls to 419. The naked put, in this case, will have lost no more than (497 – 419) / 497 * 100% = 16%.
Market crash scenarios must therefore be considered. Throughout history, the market has periodically incurred drops equal to or greater than the magnitude just described. I must limit position size as an attempt to prevent total spread risk from striking too damaging a psychological blow to my total net worth in case this should occur.
Wrapping my brain around the concept of leverage has been challenging. In the first blog post hyperlinked above, I wrote:
> Suppose I sell a 1000 put for $3.00 and buy a 500 put
> for $0.30. I have sacrificed 10% of my potential return
> to halve my risk. If I traded two of these spreads then
> I have similar risk to the single naked 1000 put and my
> potential profit is $2.70 * 2 = $5.40 instead of $3.00.
The italicized clause is correct: risk in either case is roughly $1,000 * $100/contract = $100,000. However, the market must crash to zero for the NP to realize max loss. The market must only drop to 500 for max loss to be realized on the vertical spread. This is extremely rare but think back to the 2008 financial crisis for a point of reference.
In Part 1 of the link hypertexted above, I wrote:
> A leveraged account can go to zero long before the
> underlying assets do.
Leverage is dangerous because losses are magnified when the market moves against me. This is the flip side of what makes leverage attractive: lowering the cost to enter a position.
The vertical spread is like a NP on steroids. While total risk is decreased (assuming constant position size), the probability of losing everything at risk is increased. For this reason and because a NP qualifies under the “unlimited risk” umbrella, my instincts recommend limiting portfolio allocation for these short premium strategies to 20%.
I think the vertical spread can offer one additional benefit in case of that dreaded market crash. This I will cover next time.
Categories: Financial Literacy | Comments (1) | PermalinkMusings on Naked Puts in Retirement Accounts (Part 1)
Posted by Mark on May 23, 2017 at 07:25 | Last modified: April 3, 2017 13:24I am not a proponent of trading naked puts (NP) in retirement accounts. The addition of a long put converts the NP to a put vertical spread. Might the vertical be a candidate for retirement account trading?
My argument against NPs in retirement accounts begins with the observation that retirement accounts cannot be margin accounts. I was unable to find a particular regulation that prohibits this but I don’t know of any brokerage that allows an [Roth] IRA to support any kind of loan. Margin is a loan, which would therefore be prohibited in an [Roth] IRA account.
Being resigned to trade NPs in a cash account simply does not seem like an attractive use of capital. If I have a $100,000 account then I can only sell one 1000 NP. If the put trades for $3.00 then this is a 0.3% return. If I can do this once per month then my potential annualized return is about 3.6%. As Shania Twain used to say, that don’t impress me much.
Portfolio margin—not suitable for a retirement account (see above)—makes the most sense to me for trading NPs.
Employing leverage by purchase of a long put is one alternative to make NPs more attractive for retirement accounts. In the previous example, if I buy the 900 put for $1.00 then I cut risk by 90%. Now I might be looking at a return of 2% per month or 24% per year. This is worth considering.
While purchase of the long significantly boosts potential ROI, it is not a panacea. The vertical spread does not affect maximum drawdown (DD) unless the market falls far enough to put the long put ITM. If the long put is purchased for cheap then this represents a significant market crash, which is rare. Similarly, the vertical spread does not decrease standard deviation of returns (another measure of risk as discussed here and here) unless that “significant market crash” occurs.
To illustrate, below is a risk graph of a naked put and a put vertical spread:
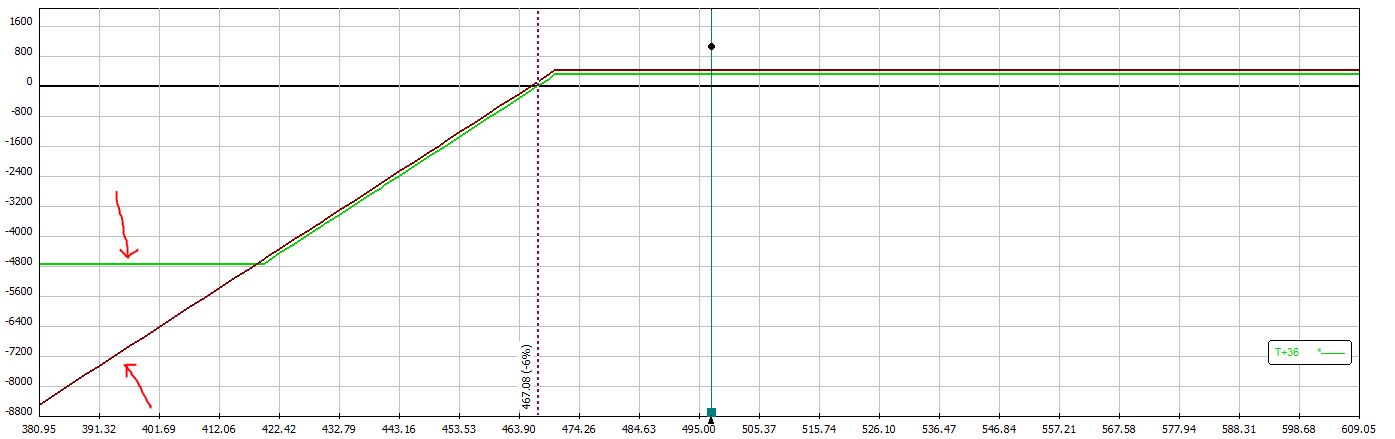
The red arrows highlight how the vertical spread stops losing money by 419 on the downside (green line) whereas the NP continues to lose money as the market drops below 419 (brown line).
Other disadvantages to the vertical spread include the additional cost and transaction fees. Being two options instead of one, a vertical spread usually incurs twice the transaction fees as a NP. Based on my experience trading in fast-moving markets, I would expect to pay [much] more than 2x under these rare conditions. This makes sense to me because under these circumstances, the most efficient way for a market maker to survive is by taking the simplest trades and executing them quickly to serially mediate risk.
I will continue this discussion next time.
Categories: Financial Literacy | Comments (2) | PermalinkLeverage (Part 2)
Posted by Mark on May 18, 2017 at 06:05 | Last modified: March 28, 2017 12:09I left off discussing the concept of leverage with regard to my previous backtesting. Today I will go one step further.
I believe maximum drawdown (DD) is as important a performance component as net income (also “total return”) because use of max DD to calculate position size can minimize risk of Ruin. If you don’t care about blowing up (i.e. Ruin) then it’s simply a matter of what can keep you from a good night’s sleep. DD is the answer here as well.
Position size is one of two ways leverage may be managed. Investment advisers assess risk tolerance in an attempt to help clients maintain a good night’s sleep. Account size and risk tolerance together viewed in terms of variable DD levels determine position size. This is not an exact science because maximum DD is only known in retrospect, which is why it’s called “investing” rather than just “winning.”
In Naked Put Study 2, maximum DD is 3.7x larger for long shares than for naked puts (NP). If I position sized the long shares properly to maintain that good night’s sleep then the NP position sizing could have been up to 3.7x larger without incurring a worse DD. This equates to net income 127% larger for NPs than for long shares.
Besides changing position size, the second way to manage leverage is to employ put credit spreads instead of NPs. I brainstormed this idea here and here.
The long put offsets “unlimited risk” by narrowing the width of the spread. If I sell a 1000 put then the potential loss is 1,000 points * $100/point = $100,000. If I also buy a 500 put for dirt cheap then my potential loss is only (1000 – 500) points * $100/point = $50,000. I halve my risk for only a slight decrease in net profit. Employing leverage in this way creates a cheaper trade with a similar potential return.
The benefit of buying long puts may be seen by equating the total risk. Suppose I sell a 1000 put for $3.00 and buy a 500 put for $0.30. I have sacrificed 10% of my potential return to halve my risk. If I traded two of these spreads then I have similar risk to the single naked 1000 put and my potential profit is $2.70 * 2 = $5.40 instead of $3.00. That is an increase of 80%.
I prefer some decrease in total risk when I employ leverage. Instead of selling two 1000 puts for $6.00 and incurring $200,000 risk, perhaps I sell three 1000/500 spreads and incur $150,000 risk while having a potential profit of $2.70 * 3 = $8.10. This is a 35% increase in profit potential with a 25% decrease in risk. I like that.
Categories: Financial Literacy | Comments (1) | PermalinkLeverage (Part 1)
Posted by Mark on May 15, 2017 at 07:04 | Last modified: February 14, 2017 16:55When I think about the largest catastrophes ever attributable to options (arguably LTCM and the 2008 financial crisis, which involved an alphabet soup of derivatives), one word that sums up the root cause is “leverage.”
Leverage is important—not only when it comes to television but most assuredly when it comes to options. Investopedia defines leverage as: “the use of various financial instruments or borrowed capital, such as margin, to increase the potential return of an investment.” It goes on:
> For example, say you have $1,000 to invest.
> This amount could be invested in 10 shares of
> Microsoft (MSFT) stock, but to increase leverage,
> you could invest the $1,000 in five options
> contracts. You would then control 500 shares
> instead of just 10.
A cash account that does not allow trading on margin employs no leverage. The only way to “blow up,” or lose everything, is to invest the entire account and see the underlying assets (for long positions) go to zero. It’s very rare that stock prices go to zero (e.g. corporate bankruptcy). No broad-based (U.S.) index has ever gone to zero.
While leverage is exciting because upside exceeds 1:1, the same may occur on the downside resulting in a greater risk of blowing up. A leveraged account can go to zero long before the underlying assets do.
I have previously done research aiming to compare performance between long shares and naked puts (NP) while keeping leverage constant. This discussion can be seen here and here. I added $5M of risk each day and when I removed risk in one group, I removed the same amount of risk in the other.
The graphs shown here and here are particularly powerful. They show the NP strategy to generate a lower gross return and a much lower drawdown (DD).
While increasing leverage is effectively an increase in position size, position size can be too large without employing any leverage. Long shares purchased in cash accounts are not utilizing margin but the account can still blow up. In retrospect, the position size can always be said to have been too large. The minimum capital to trade a strategy is at least the maximum DD ever seen and the longer a backtest, the more likely the backtested max DD is to meet or exceed future market pullbacks. This certainly is not guaranteed and given a long enough trading horizon is not even likely.
I will continue next time.
Categories: Financial Literacy | Comments (1) | PermalinkMaximum Excursion Study
Posted by Mark on May 12, 2017 at 06:45 | Last modified: February 9, 2017 10:23I previously did a study on maximum adverse excursion. Today I will discuss another study I did on maximum excursion (ME) in November 2015.
Excursions can be favorable or adverse. Maximum adverse (favorable) excursion is the largest loss (gain) during the lifetime of a trade. This is abbreviated MAE (MFE).
Although I selected a period of 23 trading days for this study, I should repeat the study over different periods to make sure the results are stable and not fluke. A period of 23 trading days corresponds to roughly one calendar month.
I used index prices for this study and looked at the MAE (downward price moves) and MFE (upward price moves) over the next 23 trading days. The study covered 3,681 data points from Jan 1, 2001, through Oct 29, 2015.
I stratified results by ventiles of a price oscillator (Osc). Osc reflects closing price as a percentage of the 23-day range ending today. Osc may range from 0 to 100. If the index closes today at a 23-day high (low) then today’s Osc reading will be 100 (0). Lower (higher) values of Osc correspond to oversold (overbought) market conditions.
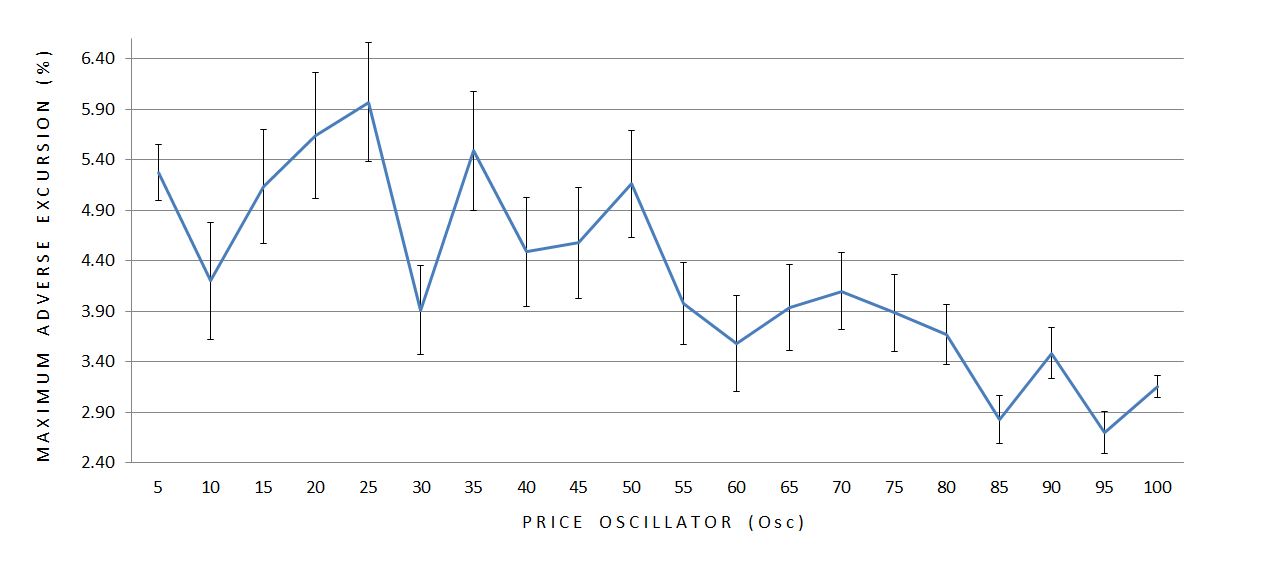
Here are the averages (mean) and standard errors of the mean (SEM) for MAE:
Here are the means and SEM’s for MFE:
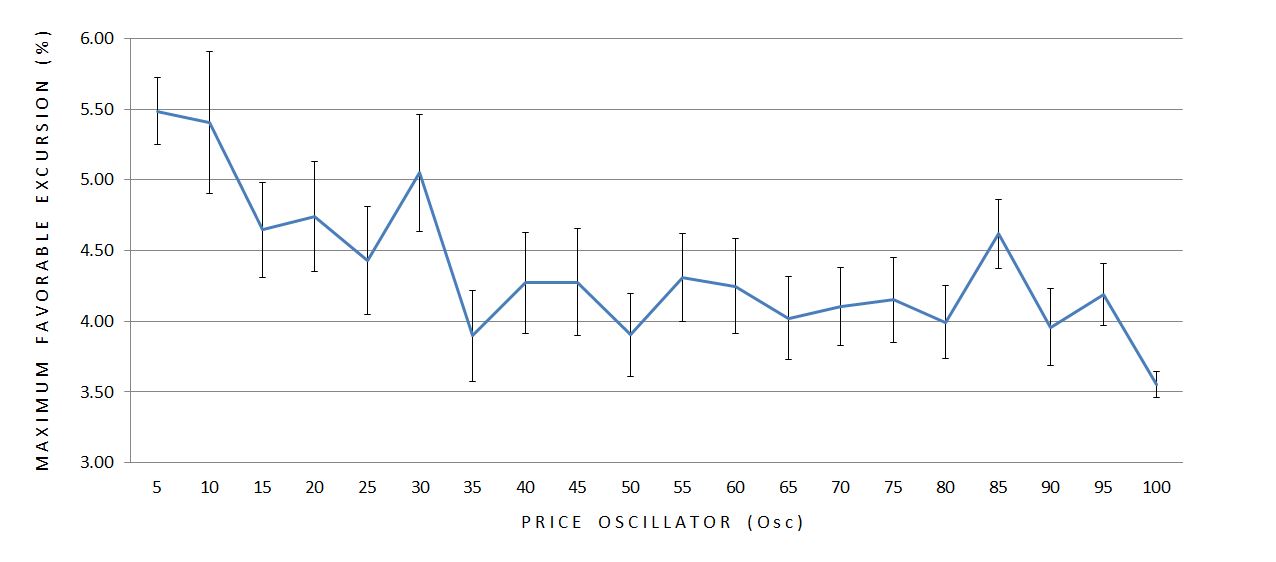
Both ME’s seem to decrease in magnitude as Osc becomes larger.* Furthermore, the variability (SEM) of the data seems to decrease as Osc increases with the exception of the first bar. Sample size is used to calculate SEM so I graphed it:
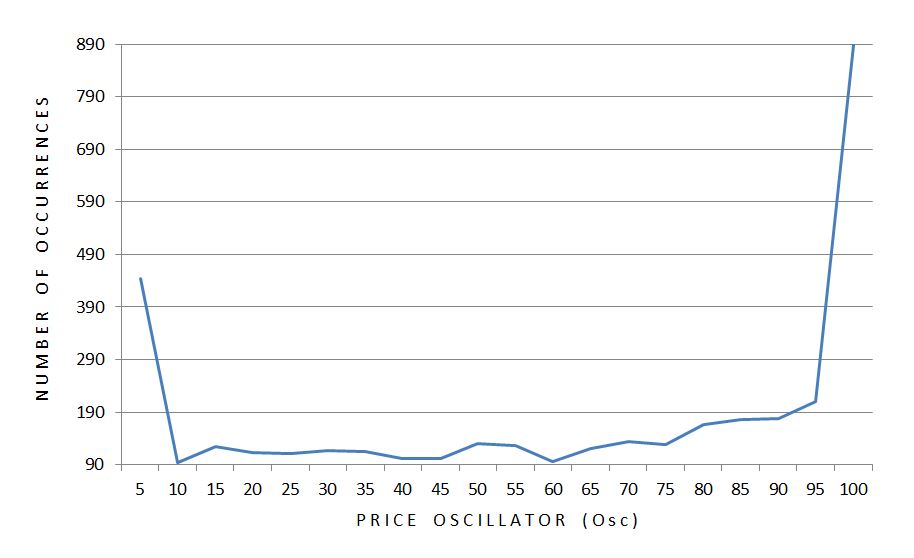
A disproportionate number of occurrences take place at the extremes. Furthermore, twice as many occurrences take place at the high as the low. Sample size could therefore explain why the smallest error bar is seen at the right edge of the graph.
Standard deviation (SD) is a measure of variability that does not correct for sample size. Here is a graph of SD across all 20 ventiles of Osc:
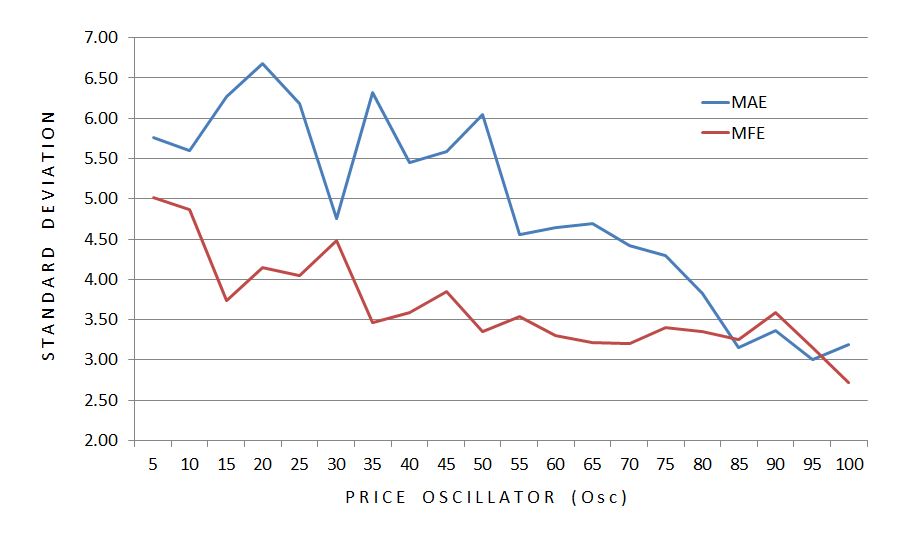
SD makes the case for an inversely proportional relationship between variability and Osc.
The smaller magnitudes of excursion as the market becomes more overbought corroborates the variability finding. Together these paint a picture of greater stability in bull markets.
This is not about trend-following vs. mean-reversion behavior. When the market is down, the larger up moves (MFE) suggest mean reversion but the larger down moves (MAE) suggest trending behavior. When the market is up, the smaller up moves suggest mean reversion but the smaller down moves suggest trending behavior. These are contradictory.
The findings make more sense from a volatility perspective. Implied volatility generally increases as the market sells off. This means larger moves are expected in either direction, which is just what we see.
* –For those interested, a single-factor ANOVA was highly significant for both MAE and MFE (p < 0.0001).
Categories: Backtesting | Comments (0) | PermalinkWelcome Trader Literacy Group!
Posted by Mark on May 9, 2017 at 07:10 | Last modified: August 15, 2017 06:21Welcome,
As I said in the initial e-mail, I trade securities for a living. I’m coming to the end of my ninth year and I’m exceedingly grateful for what I have found. I’ve been able to leave Corporate America: the 12-14-hour pharmacy shifts where I hardly got a bite to eat, where I remained on my feet continuously, and where I was forced to deal with stress over meeting business metrics.
Trading is not easy but I think half the battle is learning, which is the main purpose of this group.
Another key component to consistent trading is commitment. Just like anything else, it will fade away if you don’t use it. That’s the main reason why I’m not offering this for free. People will not pay for something to which they are not committed.
In addition to establishing some accountability, I’m charging because I’m not sure this sort of thing should be free. Trading literacy is not just for cerebral enrichment: what you do with it can potentially lead to consistent income for years and decades. What you can save by not having to pay a financial adviser over a lifetime is itself worth the upfront cost.
The trader education programs I have seen charge thousands of dollars. This will cost $20/session. I can feel good about our exchange by saving you significant money while not disrespecting the material by giving up for free what has taken me years to synthesize.
The initial Meetup message I sent was sent to others as well. You indicated definite interest. A number of people said driving to my city would not fit their schedule. Some expressed skepticism about me.
I will make it easier for all of us by conducting the meetings online. We may or may not get other participants too.
I think skepticism is always healthy when it comes to finance. Before we start I want to give you the opportunity for some due diligence on me. If you have any questions then ask away. If you want to talk to me then let’s have a phone call.
And if you want to confer with each other then I’d encourage that, too. I think working together when it comes to trading can offer significant advantages.
Thanks,
Mark
Are You Getting What You Paid For?
Posted by Mark on May 5, 2017 at 06:43 | Last modified: December 14, 2016 10:49The title of this post is the first line of the November 2016 AAII Journal “Editor’s Note” written by Charles Rotblut, CFA. I previously established that having someone else do the investing is going to cost in terms of fees and probably performance. I believe paying fees is okay as long as one knows exactly what fees are being paid.
Rotblut writes:
> Even a 1% [management] fee should raise
> questions… If both the S&P 500 and the fund
> achieve a 7% return, you lose 14%… your after-
> fee gain is not 7%, but 6%, a 14% difference.
This is misleading. Calculating percentage of percentages is a great way to magnify numbers and make them seem more sensational. To recoup a 1% fee, my adviser needs to do 1% better than the benchmark—not 14%.
> It’s not unusual to see companies pitch
> newsletters and strategies promising market-
> beating returns. Ask how they are calculated
> and you will often find out that they are
> based on backtesting or paper trades. Run
> the strategy in an actual portfolio where
> trading and transaction costs matter and
> the returns may be significantly lower.
These are excellent points. I mentioned this here in addition to a lengthy discussion beginning here.
My latest realization is that most people are probably paying more than just advisory fees. The management fee is most common and this goes straight to the adviser. My experience suggests most advisers buy mutual funds or ETFs for their clients and as shown in prospectus examples, all of these funds charge operating fees at the very minimum. So whether I hire a human or robo-adviser, I will likely be paying fees to the fund companies in addition to the advisory management fee. These additional fees may remain hidden unless I study the prospectus or ask the adviser.
> …if you are going to pay for active
> management or professional advice, be
> sure you are getting what you pay for.
This sounds good but how can it possibly be measured? For many people, I think customer satisfaction is as straightforward as beating the “benchmark” and/or seeing the investments grow.
Rotblut further explains:
> Are you getting better returns, more income,
> better education on how to invest or help
> in staying disciplined over the long term?
> [italics mine]
I covered the first two above. #3 is meaningless. “Better” education: better than what? I doubt I could even assess this. #4 is also meaningless because “help in staying disciplined over the long term” is only something that can be evaluated in retrospect. Bailing out in the midst of a market crash means I wasn’t disciplined if the market subsequently rebounds leaving me on the sidelines. Years of paying fees may pass before an event like this ever occurs.
When shopping for a financial adviser, I think it is important to identify the complete fee structure to allow for apples-to-apples comparison between different services. I’m skeptical as to whether I can determine if I am (will be) getting what I pay for. The meaningful decision is whether I want to bite the bullet and pay someone else for what I would otherwise have to do myself.
Categories: Financial Literacy | Comments (0) | PermalinkWhen Performance is Irrelevant (Part 5)
Posted by Mark on May 2, 2017 at 07:00 | Last modified: November 22, 2016 11:03This blog mini-series started out with some mutual fund prospectus examples (here, here, and here) to understand and critique how investment performance is reported. Today I continue with more excerpts from Jaclyn McClellan’s article discussing mechanics of performance comparison.
Aside from using rolling periods, another way to generate a larger sample of [potential] performance records is through Monte Carlo simulation. This has been mentioned multiple times in this blog (e.g. here, here, and here).
> Also, many of the robo services haven’t been
> around long enough to present meaningful longer-
> term return figures, hence the reporting of
> backtested results.
I am okay with using backtested results as long as the backtesting is done in a realistic manner. In order to know this, the methodology must be explicitly presented. While this is routinely done in peer-reviewed scientific journals, I have rarely seen such detailed description in financial materials like a prospectus or seminar.
> Each company stated that they have historical
> performance figures available; however, there
> were caveats. In order to see historical
> performance for Alpha Architect, MarketRiders,
> and Rebalance IRA, you must have an account.
I don’t need to be a member of Costco to walk through the store and see what kind of merchandise they offer. Why should I need to open an account simply to sample past performance?
> Alpha Architect will send historical figures
> to prospective clients on a case-by-case basis,
> or refer clients to their book, “DIY Financial
> Advisor: A Simple Solution to Build and Protect
> Your Wealth” (Wiley Finance, 2015) where the
> strategies are defined, explained and analyzed.
This sounds like a less-invasive marketing tactic than requiring me to open an account.
In summary, perhaps nothing in finance is respected more than the almighty performance record. Aside from the proper legal documents, to open a hedge fund I need little more than an audited performance record. I don’t need a degree. I don’t need a license. I don’t need a resume.
Unfortunately though, reasonable doubt challenges the validity of most traditional performance records whether or not they are officially audited. Many people think the key is what performed best in the past. I disagree. The key is what performed well in the past and/or has the best chance of performing well into the future. To determine this we need to assess for fluke occurrence. Large sample sizes, Monte Carlo simulation, and walk-forward analysis are means to this end: three tools not traditionally implemented when reporting investment performance.
Categories: Financial Literacy | Comments (0) | Permalink