Fixed Position Sizing in Trading System Development
Posted by Mark on May 5, 2016 at 06:20 | Last modified: March 24, 2016 12:31I have mentioned the importance of fixed position sizing on multiple occasions. Today I want to present another example.
Here is a table showing performance of five different investing strategies. Which one is the best?
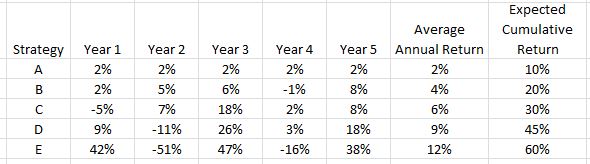
Do you agree with E > D > C > B > A?
This assumes fixed position sizing. No matter how good or bad the strategy does in any given year, fixed position sizing means I risk the same amount for the following year. This is not typically how longer-term investing is modeled. You’ve probably seen the compound growth curve that so many investing firms and newsletters like to market:
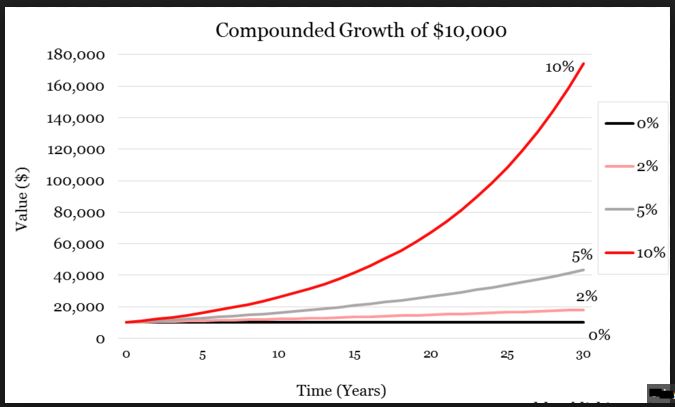
I will not get curves like this by doing the math shown under the “Expected Cumulative Return” column. Beautiful exponential curves are only possible if I remain fully invested. As the account grows, my position size grows. Exponential returns are not a by-product of fixed position sizing.
Following a fully-invested, compound-returns financial plan will generate the following from our five investing strategies:
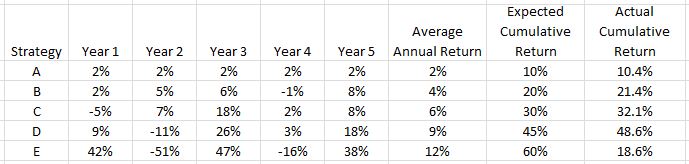
Now it seems the investment strategies should be ranked D > C > B > E > A. Note how the mighty (E) has fallen! This is the risk of trying to compound returns. Big percentage losses early leave a small amount in the account to grow when the strategy performs well. Big percentage losses late when account equity is at all-time highs have the biggest gross impact.
So which strategy is best?
We must first determine whether fixed or variable position sizing is used to better understand what we are looking at.
One additional column presents some revealing information:
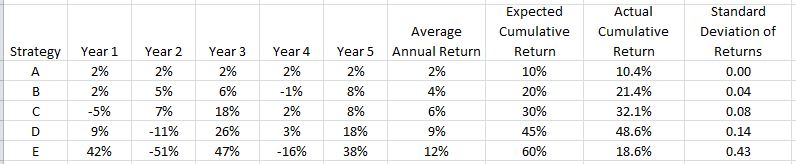
E, the strategy that initially looked best but proved to be rather poor, has by far the highest standard deviation (SD) of returns. SD measures variability of returns. This is why the Sharpe Ratio—a performance measure where higher is better—has SD in the denominator.
In summary, when comparing performance higher average annual returns are better but only to a point. Returns must also be consistent because excess variability can be detrimental. This is why I often study maximum drawdown: the kind of variability capable of keeping me up at night and causing me to bail out of a strategy at the worst possible time.
Comments (1)
[…] strongly affirmed by the standard deviation (SD), though, which becomes much smaller. Once again, SD is a measure of risk so this is […]