Short Premium Research Dissection (Part 2)
Posted by Mark on February 26, 2019 at 07:03 | Last modified: November 16, 2018 15:18I continue today with my critique of some recently-purchased research. This tells a story that should be interesting and compelling to option traders. For this reason, I don’t mind if this mini-series is lengthy.
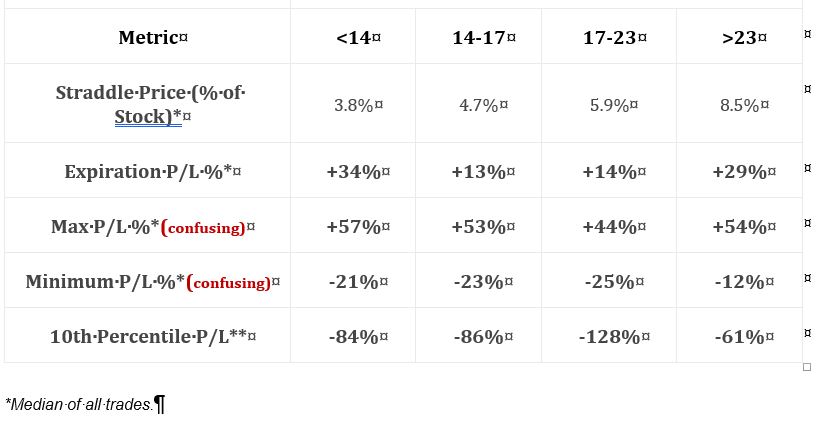
Skipping ahead a couple sections, this table breaks down straddle data into four categories of VIX level with an equal number of occurrences in each:
Inclusive dates and number of occurrences need to be given every time. The section mentioned in Part 1 said “since 2005” whereas text in this section says “since 2007.” Which is it?
Text in this section says “analyzing these four ranges across four different entry time frames would leave us with an overwhelming amount of data, so we’ll be using the 60-day straddles for this analysis.” I think we can therefore assume 60 DTE.* As a critique, though, I never want to see weak excuses like this when I’ve paid good money to get something. If you told me “data are condensed for simplicity” ahead of time, then I would never have trusted enough to purchase it. This screams “I’m too lazy.” The only reason to condense is for having valid reason to do so.
Row 4 is confusing because it contradicts the first table presented in Part 1 where the worst loss was stated to be -390%. These numbers aren’t anywhere close to that. Row 5, which gives the 10th %’ile to help define the distribution, is more consistent with -390%.
I miss the standard of practice for reliable methodology reporting seen in peer-reviewed scientific literature. The “methods” section of a peer-reviewed article lays out precisely-defined steps that could be followed to repeat the study. I want to see a recap of the methodology used to generate every table and graph shown in a backtesting report (see fifth paragraph here). If presented in the same section, then restatement may not be warranted. At the very least, the first table or graph in every section should be accompanied by well-defined methodology.
If I don’t even have mention of methodology to suggest the author’s head is in the game, then I have added reason to suspect sloppy and inconsistent work. Especially given the fact that people I meet in the trading community are complete strangers, I do not want to assume a thing. It’s my hard-earned money on the line and with all the stiff disclaimers up front, the author is not accountable. This is another reason why I would prefer to do my own research.
* I still want to see number of occurrences for confirmation. I want to see redundant statistics all over
the place to cross-confirm things, really.