Short Premium Research Dissection (Part 3)
Posted by Mark on March 1, 2019 at 07:38 | Last modified: November 17, 2018 12:33Conclusions drawn from the table shown here are debatable.
She writes:
> While it may be counterintuitive, selling straddles in the lowest IV range
> was typically more successful than selling straddles in the middle-two IV
> ranges, despite collecting less overall premium. The reason for this is
> that when the VIX Index is extremely low, the S&P 500 is typically not
> fluctuating very much, which leads to steady option decay that leads to
She provides no data on this, and as an EOD study, large intraday ranges may have been masked altogether. HV or ATR are better indicators for how much the market moved. IV reflects how much the market is expected to move.
> profits for options sellers. The biggest problem with selling options in
> low IV environments is that you collect little premium, which means your
> breakeven points are close to the stock price.
All of this makes obvious sense. I would caution against trying to explain “the reason.” It is a reason but who knows why it is. The only thing that matters is that it was an edge in the past. Part of our job as system developers is to look deeper and see if it was a consistent and stable edge. I think it is also our job when developing systems to determine how likely the edge was to be fluke (see third paragraphs here and here), and what we should monitor going forward to know the edge persists.
Said differently, as system developers we must know what we should be monitoring in real-time to know when the system is broken. Only retrospect can ultimately determine whether a system is broken, but we must have criteria in place such that when we see something reasonably suspicious we can take action (and exit).
She continues:
> Conversely, selling options in the highest IV range has historically
> been successful because you collect such a significant premium, allowing
> the market tons of room to move in either direction while remaining in
> the range of profitability.
As before, this makes obvious sense since the data are consistent with the interpretation (reminds me of the financial media as described in the fourth-to-last paragraph here). Is this truly the reason? Not if we look back 10 years from now and see the data trends reversed.
If I were to include this content at all, I might have phrased it by saying “one way to make sense of these data is to think of low IV as… and to think of high IV as…”
Taking a step back, we do not even know if the groups are actually different without a statistical analysis (see links in the third-to-last paragraph here). And again, we do not know how many trades are in each group.
Moving onto the next table:
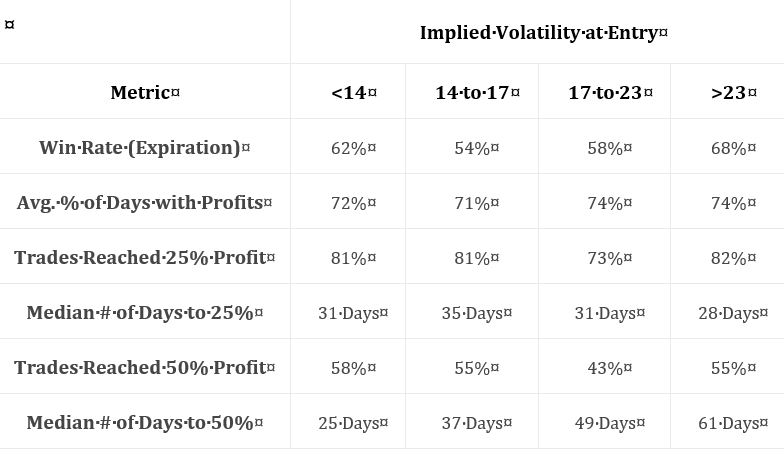
Again, no statistical analysis is performed.
However, I do think it meaningful that all groups showed 73% or more trades hitting 25% profit.
By the way, does this include winners and losers? I think it should include just winners. Do rows 4 and 6 include winners and losers? I think those should include just winners. See my last two paragraphs in Part 2 about lack of transparent methodology.
For kicks and giggles, she then writes:
> But why do the middle-two VIX entry ranges show slightly worse trade
> metrics compared to the lowest and highest VIX entry ranges?
At least she doesn’t try to apply the above explanations for low and high IV to these two groups!