Short Premium Research Dissection (Part 4)
Posted by Mark on March 4, 2019 at 06:59 | Last modified: November 27, 2018 10:13She continues with the following table:
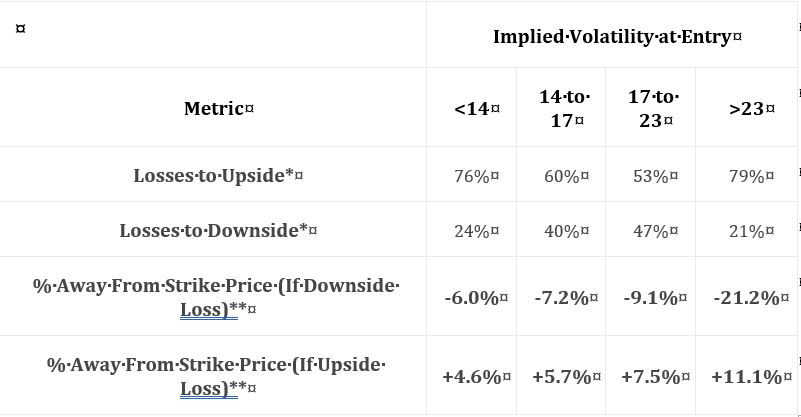
I find this table interesting because it gives clues about how the naked straddle might be biased in order to be more profitable. Once again, the middle two volatility groups show a greater failure rate to the downside. I don’t know why this is and I wouldn’t want to make too much of it especially without knowing whether the differences are statistically significant (see critical commentary in the third-to-last paragraph here). I do see that overall, failure rate is unanimously higher to the upside, which makes me wonder about centering the straddles above the money.
I would like to see the distribution of losing trades over time in order to evaluate stability. Are many losing trades clumped together in close proximity—perhaps in bearish environments? “Since 2007,”* we have been mostly in a bull market. We won’t always been in a bull market. Do the statistics look different for bull and bear? If so, then is there something robust we can use as a regime filter to identify type of market environment? Consider a simple moving average. We could test over a range of periods (e.g. 50 to 250 days by increments of 25) to get sample sizes above and below. We could then look at loss percentages. An effective regime filter would have statistically significantly different loss percentages above vs. below at a period(s) surrounded by other values that also show significant loss percentage differences above vs. below.
The last two rows are not crystal clear. The first row of the previous table (in Part 2) mentioned expiration. I’m guessing these are similarly average percentage price changes between trade entry and expiration. I shouldn’t have to guess. Methodology should be thoroughly explained for every section of text, at least, if not for every table (when needed).
Assuming these do refer to expiration, I would be interested to see corresponding values for winning trades and a statistical analysis with p-value along with sample sizes (as always!). I would expect to see significant differences. Non-significant differences would be an important check on research validity.
I have rarely found things to go perfectly the first time through in backtesting. While it might look bad to see confirming metrics fail to confirm, a corrective tweak would go a long way toward establishing report credibility. As a critical audience, which we should always be if prepared to risk our hard-earned money in live-trading, it is very important to see an accurate documentation of research flow along with everything that was [not] considered, included, or left out. Remember high school or college lab where you had to turn in scribbly/illegible lab notebooks at the end to make sure you did real work?
* Assuming this descriptor, given several sections earlier, still applies. Even if it does, the
descriptor itself does a poor job as discussed in the second full paragraph here.