Practice Trades Cal 1.10 – 1.11
Posted by Mark on February 22, 2022 at 07:28 | Last modified: December 24, 2021 09:15Cal 1.10 (guidelines here) begins 5/4/20 (74 DTE) with SPX 2838 and 2840 puts -$168 (-2.4%). MR is $7,128 (two contracts), TD 29, IV 31.4%, horizontal skew -0.02%, NPD 1.4, and NPV 216.
MDD is -$1,048 (-14.7%) on 44 DTE.
Exit trade 42 DTE for loss of $2,158 (-30.3%). SPX up 1.3 SD to 3190 with IV down 40% over the 32 days. Horizontal skew up to +0.6%. This trade exits on that same big up day as Cal 1.9 with a 2.2 SD one-day rally.
Anecdotally speaking (since I’ve only backtraded 10 so far), the last two calendars have not had the snap seen in some earlier ones. With the high IV “juice” and/or [significant] positive skew, perhaps it’s not unusual for calendars to reach PT in sudden, unexpected fashion. In contrast, this trade (and the second half of Cal 1.9) faces a market steadily grinding higher.
What if I placed Cal 1.10 at -0.65 delta rather than the first 10-point strike above the money?
Cal 1.10A begins 5/4/20 (74 DTE) with SPX 2838 and 3000 puts (roughly -0.65 delta) -$168 (-2.4%). MR is $6,578 (two contracts), TD 3 (expectedly lower being farther ITM), IV 31.4%, horizontal skew -0.6%, NPD 7.7, and NPV 241.
MDD is -$448 (-6.8%) on 65 DTE.
Exit trade 56 DTE for profit of $742 (11.3%). SPX up 0.58 SD with IV down 24% over the 18 days. Horizontal skew has decreased to -1.0%, which is not good for getting into the trade but can be very good while in the trade.
In this instance, leaning bullish rewrites history. Whether this accurately reflects a larger sample size remains to be seen.
Cal 1.11 begins 5/11/20 (67 DTE) with SPX 2934 and 2940 puts -$168 (-2.4%). MR is $7,128 (two contracts), TD 19, IV 22.0%, horizontal skew -0.9%, NPD 1.6, and NPV 233.
MDD is -$1,378 (-19.3%) on 39 DTE: just a slight breeze shy of ML.
Exit trade 36 DTE for profit of $2,282 (32.0%). SPX up 0.38 SD with IV up 80% over the 31 days. Horizontal skew has increased to +1.3%. The underlying price action behind this trade is as follows:
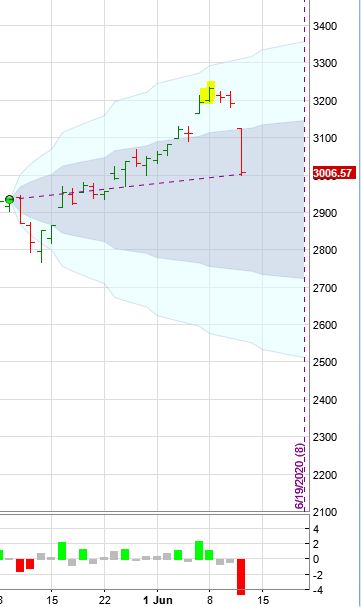
The gradual, grinding-higher market resulted in two consecutive losers. This is almost the third. MDD occurs on the highlighted bar, which is just three days before a 4+ SD downmove carries home the W. The highlighted bar presses the market well into the second SD of the probability cone: an extreme I suspect usually does not persist [but most certainly can].
Trading’s version of Bruce Willis (apologies in advance) is mean reversion with a vengeance.