2021 Performance Review (Part 3)
Posted by Mark on April 1, 2022 at 07:04 | Last modified: February 8, 2022 11:19I left off presenting a comparative graph of my trading performance versus the major indices from 2001 – 2021. The graph is best considered a rough draft, though, for a couple different reasons.
My trading has significantly changed over the years. From 2001 – 2006, I researched systematic criteria and used those to pick stocks. In 2007, I started trading equity options, and in 2008, I went full-time trading [mostly] index options. Even for the latter, my option strategies have evolved. I could make a case to completely separate out 2001 – 2007 but for now, just realize the graph does not portray performance of one fixed strategy over two decades.
I think the main thing masked by the graph has to do with taxes. Disclaimers I hear over and over include things like “please consult a tax professional,” “everyone’s tax situation is different,” and “your results may vary.”
Performance shown by the Part 2 graph could conceivably be achieved in a Roth IRA with after-tax money.
More likely, though, much of this trading is done in taxable accounts and for that reason, I want to do what I can to normalize the comparison between my portfolio and the benchmarks. What I am not looking to present are after-tax returns, which [per disclaimers above] may not be applicable to a heterogeneous audience.
I assume the benchmarks to be buy-and-hold [over 12 months] whereas my trading is generally short-term. The former qualify for long-term capital gains (LTCG) tax rates whereas the latter gets taxed as ordinary income. For the same reasons to err conservatively discussed in the last post, I feel hiding this would be deceptive.*
Although short-term, my trading does qualify for the blended tax treatment afforded to Section 1256 contracts where 60% the profits are taxed as long-term. This is still complicated because one’s total net worth dictates position size, which dictates magnitude of profits [or losses], and subsequently tax rates.
Here are the numerous tax-rate combinations of LTCG (second column) and ordinary income (third column) for 2021:
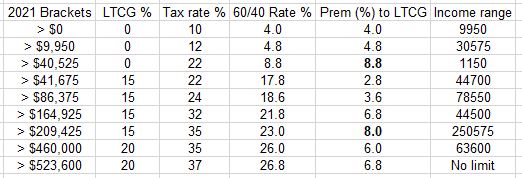
The fourth column sums 60% of the second column and 40% of the third column. The fifth column shows by what percentage the ordinary-income tax rate exceeds LTCG. The sixth column shows over what range of income this differential applies.
To make matters even more complex, tax rates have changed over the years. Aiming to err on the side of conservatism spares me from having to hunt down all tax-code changes to apply for each respective period.
I will explain this next time.
* — I do believe many financial professionals hide it, though, because it
may be easily swept under the mat with disclaimers as given above.