2021 Performance Review (Part 7)
Posted by Mark on April 14, 2022 at 07:22 | Last modified: February 10, 2022 17:45Last time, I decided to exclude results from my 2001 – 2007 stock trading years. I also settled upon a custom benchmark combination of RUT/SPX to more closely parallel my trading vehicles. I am finally ready to delve into the numbers.
Here is my performance record as a full-time option trader since 2008:
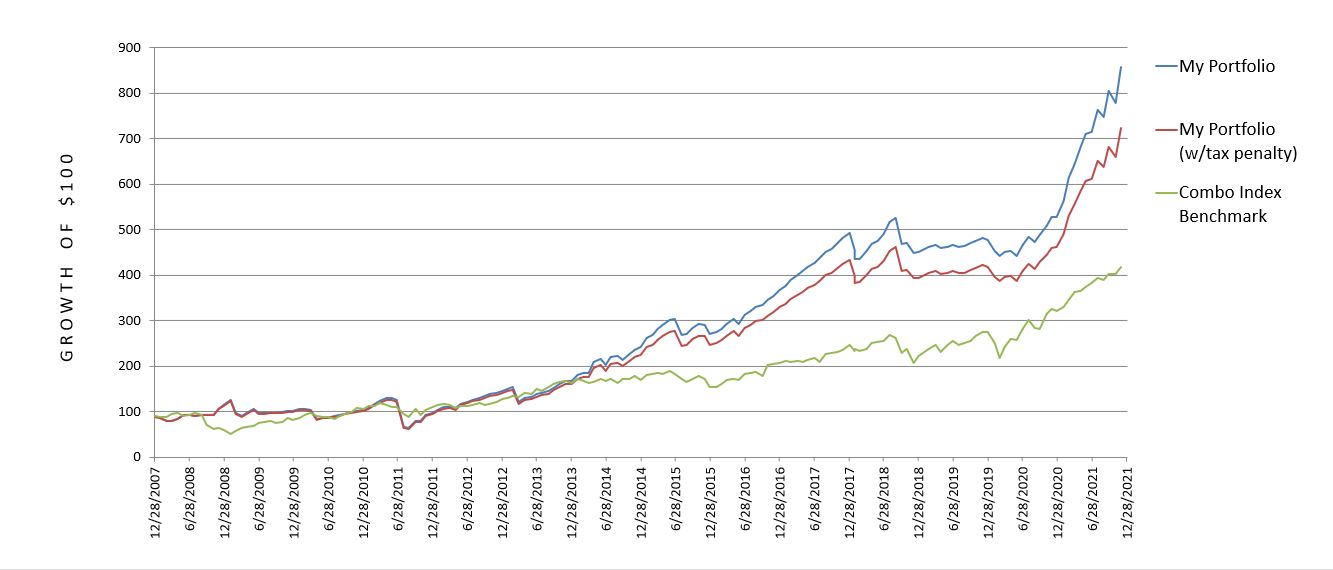
Since 2008, I have posted an average annual return of 15.17% vs. 10.75% for the combo index benchmark: outperformance of at least (see fifth-to-last paragraph here) 4.42% per year. A Motley Fool article from 2/1/22 writes:
> The S&P 500 gained value in 40 of the past 50 years, generating an average annualized return of 9.4%.
If sold, taxes are still due on these funds in the form of LTCG. The same is true for the combo index benchmark (green) and my red (penalized for active trading) equity curve.
My non-penalized (blue) equity curve simply shows taxes do matter (my annualized return would be 16.59% sans penalty). I think inquiring about tax implications and trading frequency is an integral part of due diligence on potential investment advisors (IA), money managers, or strategy vendors.
Pop quiz: does the blue curve apply if done in a Roth IRA?
Answer: please consult a tax professional for specifics about your individual situation. From my understanding, though, no tax liability remains on after-tax funds, which means the blue curve underestimates equity. The combo index benchmark still owes taxes in the form of LTCG (unless eligible for step-up at death, perhaps).
I would be elated to maintain benchmark outperformance of 4.42% p.a. if claims that most IAs underperform are true.
Total return does not tell the whole story, however. I believe drawdown (DD) is equally important for performance evaluation (see last paragraph here):
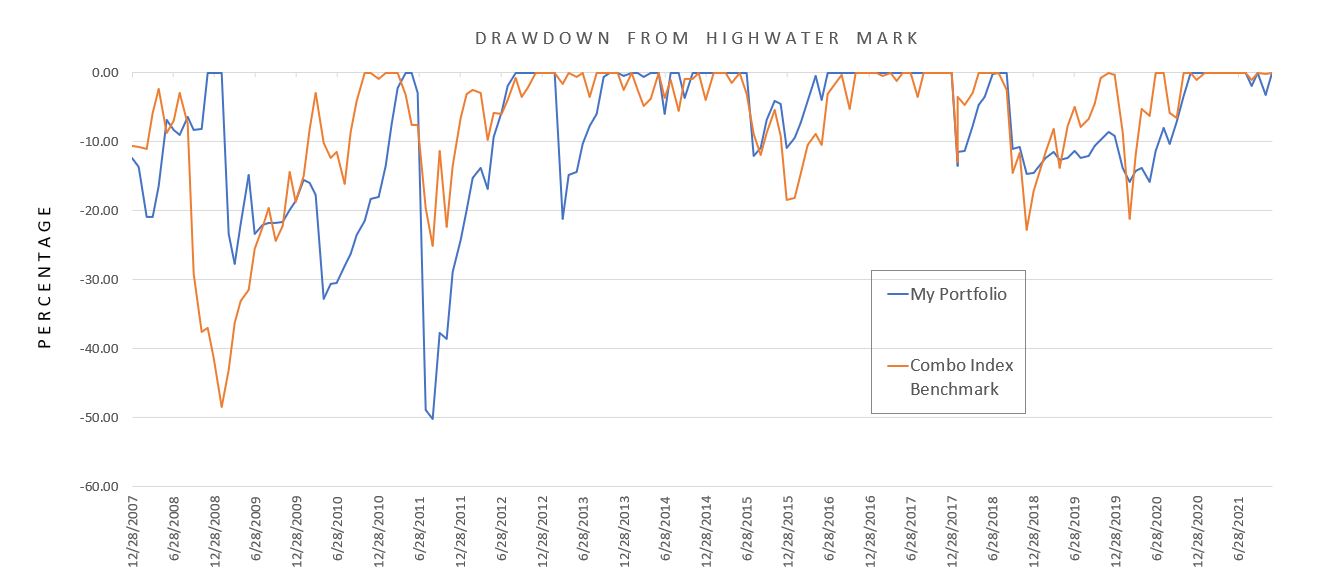
My maximum drawdown (MDD) is -50.10%, which is slightly worse than the benchmark’s -48.39%. That does not take place during the financial crisis, which I manage well. My MDD occurs in Aug – Sep of 2011 with the benchmark only down 25%. My average DD across all months is -8.86%, which is a bit worse than the benchmark’s -7.17%.
I am happy with my total return, but not so much with my DD statistics (risk management). Unfortunately, as part of the historical record I cannot improve on MDD. Going forward, I can work to exit sooner if I see signs of market turmoil. If the market falls more than 50.1% at some point and my portfolio falls less (or gains), then I can jump ahead on a relative basis in terms of MDD. These efforts may or may not succeed, though. There are no guarantees.
I will continue next time.