2021 Performance Review (Part 8)
Posted by Mark on April 18, 2022 at 07:20 | Last modified: February 12, 2022 09:29I left off discussing drawdown (DD) statistics and my dissatisfaction with this aspect of my trading performance. My current maximum DD is the best it will ever be.
The DD [second] graph shown in Part 7 does suggest my risk management to be getting better. Since late 2013, benchmark pullbacks over 15% have been less for my portfolio: -11% vs. -18% in Jan 2016, -15% vs. -23% in Dec 2018, and -16% vs. -21% in Mar 2020. I may be even better on a daily basis than these end-of-month values reflect. In 2020 when SPX drops 34% (bottoming out on March 23), my account equity is down less than 12%.
I feel more risk-averse and cautious as I get older. This is a main reason why I made significant changes to my trading strategy in Dec 2018 to carry insurance at all times. Some people say as a mean-reverting asset class, volatility should be sold when high. A caveat is the rare case when “high” is a prelude to much higher: a chance I no longer wish to take.*
The big DDs are truly permanent losses and therefore worth some price (see this post) to avoid. My account can still reach a new post-DD high, but it won’t be as high as it would have otherwise been.
I’d like to present a few of the big drawdown periods along with the million-dollar question: is there anything I can do to avoid these kinds of equity drops?
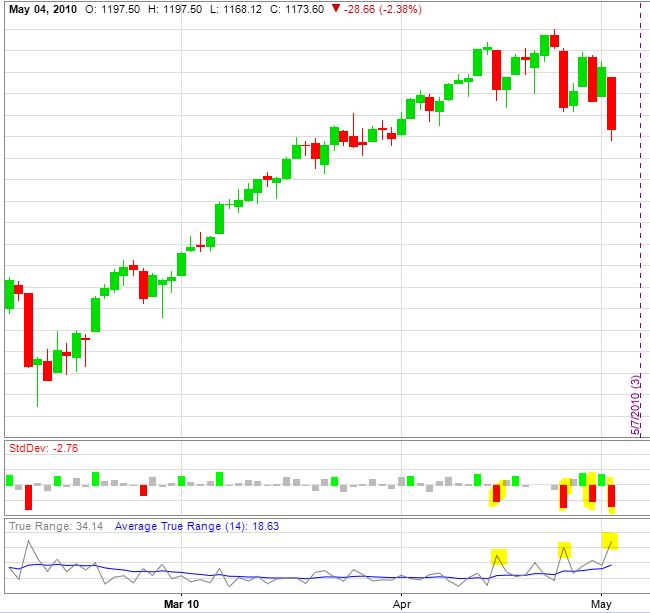
In the May 2010 Flash Crash, I lose 32.77% with the combo index benchmark down 10.23%. I’ve heard a lot of traders say “the writing was on the wall” for this one. What do you think?
If this is going to be my signal, then I need to be ready to take action immediately. I should also be prepared for a near-term profit vacuum due to lag time before I get a full position in place once again.
On the upside: “cash is a position too.” On the downside: “opportunity cost, baby.”
At first glance, the volatility story ahead of the Flash Crash is somewhat equivocal. Only in hindsight is closing up shop and preparing for the worst an easy decision.
Aug 2011 is catastrophic with a loss just over 50% vs. the combo benchmark down half that. Do you see what comes next?
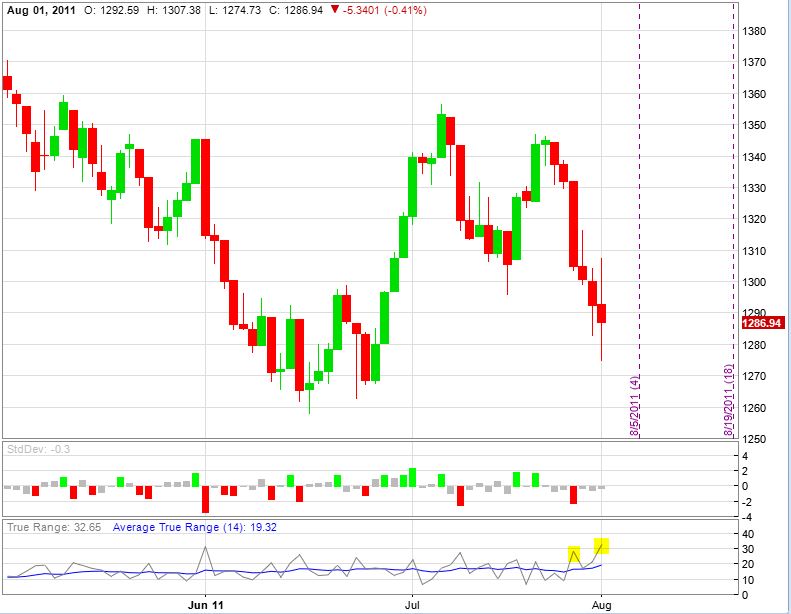
This is much less convincing to me from a technical standpoint. The volatility story, however, is unequivocal.
Neither of these are smooth sailing, per se, but if sufficient to sound the alarm then how many profitable opportunities will be missed and how will that affect long-term performance?
It bears repeating: only in hindsight is closing up shop and preparing for the worst an easy decision.
I will continue next time with one more case study.
* — The story may be different for a client who hires me to manage 10-20% of their portfolio
and target outsized returns knowing the most they can lose is a fraction of their total.