Short Premium Research Dissection (Part 14)
Posted by Mark on April 9, 2019 at 06:55 | Last modified: January 11, 2019 06:59I left off discussing the possibility of curve fitting with the VIX filter. I discussed a related topic, future leaks, in the footnote.
Curve-fitting is accentuated when an additional condition snipes just a few horrific occurrences. That is what our author does.
An alternative method might have been to run the backtest with a VIX < n filter where n varies from 15-45 by increments of three. This could also be done as VIX > n to more clearly see number of occurrences being filtered out, where the breakeven cutoff occurs, and the consistency of returns around the VIX threshold.
Even this reeks of future leak because the threshold value during the backtesting period is determined by performance of trades that have not yet occurred. A walk-forward process (see here) might be the only way around.
She closes the sub-section with:
> Additionally, portfolio performance could have improved even further
> by exiting losing trades closer to the 100% stop-loss threshold.
Curve-fitting often involves an attempt to make results look the best, which is what the author sounds to be aiming for here. As discussed in this second paragraph, she discusses these excessive losses as a limitation of backtesting when, in fact, her own methodology is flawed because transaction fees are not included. I would rather see her embrace these excessive losses if only to reflect increased slippage during fast-moving markets.
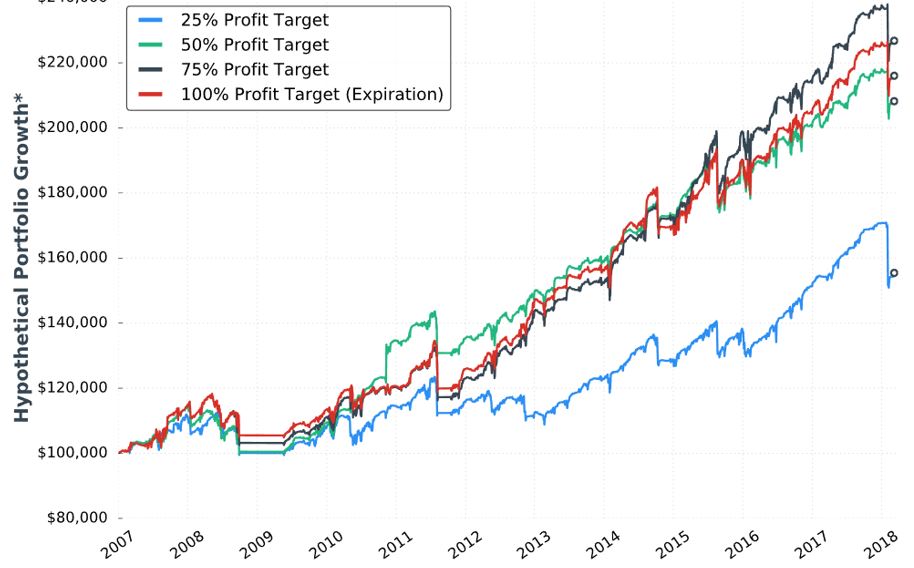
The next sub-section addresses profit target with the seventh “hypothetical portfolio growth” graph:
No statistics are given. None. I’d like to see the standard battery of statistics as listed in the footnote here.
I applaud her conclusion that the 50-100% profit targets perform the same. We don’t have the statistical analysis to conclude a real difference exists. If she would have claimed 75% to be the best, then I would have noted the black curve only takes the lead in the last three years. We might get more insight from the larger sample size generated in backtesting daily trades.
She writes:
> I believe each portfolio’s performance would have improved if
> losing trades were exited closer to the -100% stop-loss threshold,
> as some of the losses far exceeded that threshold.
As discussed above, she needs to embrace the excess losses or incorporate transaction fees into the backtesting.
> The 25% profit target underperformed the other groups because
> many trades reach… 25%… which leads to smaller profits
> and the same loss potential relative to the higher profit targets.
I agree. Once again, my issues with Tasty Trade come to mind, as mentioned in the paragraph above the table here.
She advocates closing trades prior to expiration because full risk and little additional reward remains. This is consistent with Tasty Trade research (unlike the third paragraph of Part 13, which seems to disagree). This makes me curious to see DIT and PnL/day numbers for the different profit target groups (including 100%).
In the sub-section header, she mentions the graph to be for VIX < 30 (along with 60 DTE, 5% allocation, and -100% stop-loss). This also incorporates a 25-delta long call (LC). She is therefore taking the best looking curves from the two previous conditions and trying to improve upon them even further. Her sequence is LC, volatility filter, and finally profit target. Although I still like her conclusion that the 50%/75%/100% profit targets perform about the same, I suspect curve-fitting even more because she has optimized only one sequence of parameters (see third paragraph here).
Categories: System Development | Comments (0) | Permalink