Short Premium Research Dissection (Part 13)
Posted by Mark on April 4, 2019 at 06:56 | Last modified: December 11, 2018 11:00Following up to the last paragraph of Part 12, my characterization of the long call (LC) seems to understate. The author emphasizes an increased win rate (from 62% to 82%) with the 25-delta LC. This is much more than my “once every 10 years” but only noticeable on the chart’s right edge. She explains this by saying the combined positions have no upside loss potential. I would like to see a matched PnL comparison (with vs. without the LC) for trades where the underlying increased in price to better understand this. A PnL histogram might also work.
Let’s do a parameter check. Building on the second paragraph of Part 11, we now have four different values each for the DTE and entry IV, four values for profit target, three values for allocation (unless allocation affects everything proportionally?), four values for stop-loss, and three values for LC delta. This is a total of 2,304 different strategy permutations. The Part 12 graph includes only [closest to] 60 DTE trades under all VIX conditions, -100% stop-loss, but no profit target (stay tuned).
The call vertical, created by adding the LC, will decay slower than the naked. The author doesn’t seem to care much about getting out of trades sooner to maximize PnL per day (and % winners). The latter is a Tasty Trade mantra, which I mentioned just above the table shown in Part 10. Maybe this is why PnL per day is not a statistic she presents. I just wonder whether omitting it leaves out a big part of the story.
In the next sub-section we get the sixth “hypothetical portfolio growth” graph:
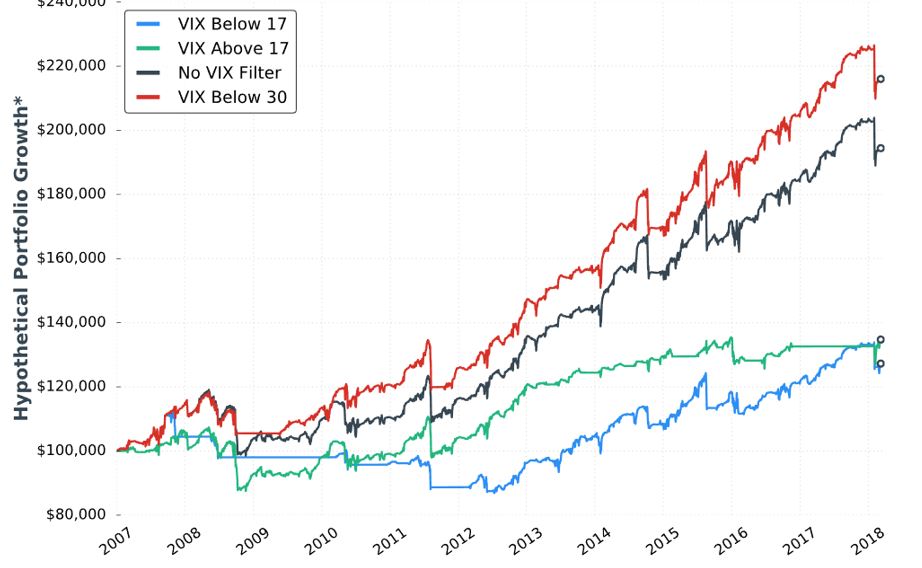
I’ve stopped griping about the lack of detailed methodology (last mentioned below the table shown here), but in broad terms this is 5% allocation, -100% SL, and [closest to] 60 DTE. The fifth graph was identical minus the VIX < 30 curve. After seeing the VIX filters dramatically underperform, she added the red curve.
This seems like curve-fitting. She writes:
> The VIX below 30 filter outperformed everything we’ve tested thus far
> because multiple losing trades were avoided by not re-entering short
> straddles after being stopped out of previous trades when the market
> started to plummet in 2008.
I get the impression she realized when the biggest losses occurred and selected a filter value to avoid those losses. In fact, it doesn’t take a 30 VIX to cause huge losses. If VIX doubles from the lower teens, then huge losses may be incurred. This happened in February 2018. I would prefer to see a filter that exits trades (or prevents entry of new trades) when VIX spikes above resistance or hits an x-day high that only happens 5-10% of the time.* I’d still like to leave a sufficiently large sample size (e.g. at least 30-50 out of 4000 trading days since 2001 although we should be mindful of data clumping).
She provides no statistics in this sub-section. As always, I’d like to see the standard battery. I’d also like to see a comparison of these statistics between the VIX < 30 filter and no VIX filter.
I will continue next time.
* Looking back throughout the entire data set and selecting a VIX level that only occurs x%
of the time as a filter creates a future leak because it applies future information to trades
made earlier in the backtest. Selecting an x-day high that only occurs y% of the time
throughout the entire data set is similarly flawed.