Short Premium Research Dissection (Part 10)
Posted by Mark on March 26, 2019 at 07:06 | Last modified: December 6, 2018 06:26This blog mini-series is a critique of a premium selling research report that I purchased.
In the next sub-section, the author makes a command decision to stick with the -100% SL level. Her reasoning goes back to the first table here showing the 10th %’ile P/L to be -83% (60 DTE). Since only 10% of trades will even reach 83% loss, she eliminates -150% and -200%.
I like the reasoning, but this is not how I would expect parameters to be optimized. This seems to come out of nowhere and has nothing to do with PnL. I think useful statistics could result in a meaningful evidence-based conclusion. By not using her own statistics, she implies they don’t help. If that is true, then she needs to present different ones.
On a related note, she continues:
> Based on this logic and the results found above, I believe
> the -100% stop-loss level is a great starting point for…
> [a systematic trading approach].
Again, I like the logic, but it’s not based on “results.” That is the evidence-based aspect I really want to see. As a “great starting point,” she could now go on to use statistics to choose between 50% and 100%, but she doesn’t.
Instead, she moves on to study profit target. Keeping DTE fixed at [monthly expiration closest to?] 60, allocation fixed at 5%, and stop-loss at -100%, she gives us the third “hypothetical portfolio graph” seen in the report thus far (confusing, as discussed in the last paragraph here) for 25%, 50%, 75%, and 100% profit targets:
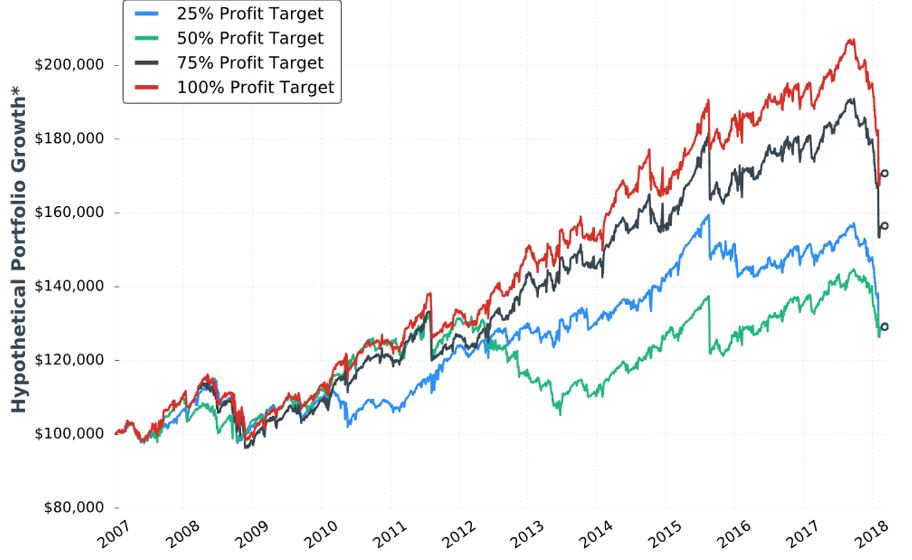
A control group should be included anytime a new condition is introduced. I would like to see data for “no profit target.”
She writes:
> To me, this makes complete sense because most short
> premium options trades will be winners. By cutting those winners
> short and booking smaller profits, there’s less profit
> accumulation to absorb the inevitable losses. When booking
> smaller profits, the overall probability of success
> needs to be incredibly high to remain profitable over time.
This makes sense, but it directly contradicts Tasty Trade studies. The latter have always shown better performance with winners managed sooner. Could it be a matter of days in trade and P/L per day? She offers a few statistics:
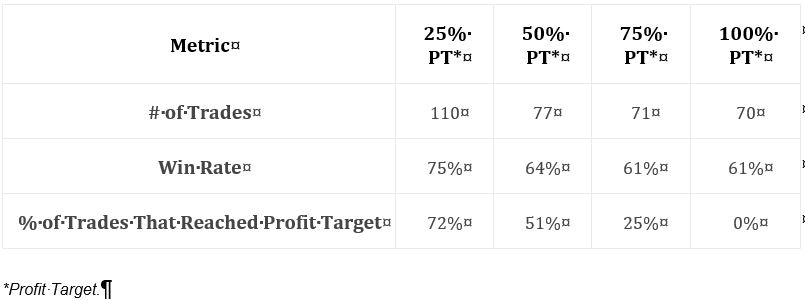
Along with the graph, this table suggests the 25% profit target group to be less profitable despite having significantly more trades. It’s therefore not about P/L per day because we are seeing a lower DIT and therefore more overall trades.
I’d still like to see more statistics, and this amounts to the same list I’ve been including over and over throughout the mini-series: distribution of DIT and losses including max/min/average [percentiles], average trade [percentiles], average win, PF, max DD %, CAGR, CAGR/max DD %, standard deviation (SD) of winners, SD losers, SD returns, total return, PnL per day, etc. The table alone does not indicate what PT level is most profitable: it should.