Short Premium Research Dissection (Part 11)
Posted by Mark on March 29, 2019 at 04:22 | Last modified: December 6, 2018 07:04Because of the peculiar way our author settled on the -100% stop-loss (SL) level, I would like to see this graph and table redone for other values as a consistency check. I can’t trust her conclusions based on one set of parameters.
I am surprised to find myself wanting additional graphs and tables, though. Reviewing the first paragraph of Part 9, we now have four different values each for the first two variables, four values for profit target, three values for allocation (unless allocation affects everything proportionally?), and four values for SL. This is a total of 768 different strategy permutations.
It is not like me to want hundreds of different graphs because I’m not sure I would know how to make sense of them. This reminds me of the last sentence of the second-to-last paragraph here. If we approach this by holding three parameters constant while varying the fourth over a range and then taking the reasonable values for the fourth and using those to test varying the other three to optimize all four, then do we have to repeat the process by starting out in succession with each of the other three parameters to vary first?
This gets very complicated. I feel the need to review Tomasini and Jaekle:* now!
Let’s press on with her next data table (PT is profit target):
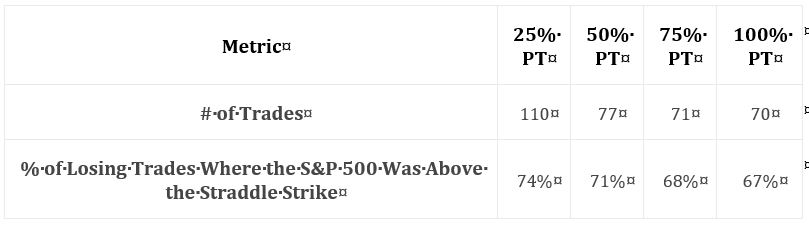
This suggests the majority of losses is coincident with market appreciation. She goes on to claim most trades hitting the -100% SL are caused by sharp market declines. I’d like to see these numbers and percentages included in the table.
Another thought I have regards her nebulous methodology. These are small sample sizes. Why not backtest daily trades (as explained in the second paragraph here)? If not daily, then trades could at least be run starting every x days or every week. The groups might have to be redefined, but I certainly don’t think it’s asking too much to see at least 24 – 48 trades per year.
She claims 81% of losing trades (in a 100% PT / -100% SL portfolio) that do not get stopped out are victims of market appreciation. 81% does not appear in the table. Including some data in the table and leaving other data out is sloppy.
As I mentioned in the second paragraph here, all this suggests initiating trades OTM to the upside.
Our author does not tackle this, however. I will discuss her alternative next time.
* Jaekle, U, & Tomasini, E (2009). Trading Systems: A New Approach to System Development and Portfolio Optimisation.
Hampshire, Great Britain: Harriman House.