Short Premium Research Dissection (Part 20)
Posted by Mark on April 29, 2019 at 06:38 | Last modified: December 18, 2018 06:01I left off discussing allocation as a possible confounding variable rather than the independent variable our author tries to present. This is where she picks up in the next sub-section.
As discussed below the second table here, kudos to our author for giving us fuller study methodology. Positions include 16-delta put and 25-delta call. Trades are entered closest to 60 DTE only when VIX < 30. Trades are sized to max loss (rather than 100% stop-loss). Trades are closed at 75% profit target or at expiration. Again, she does not give us exact backtesting dates, number of trades, or a statistical analysis of differences. The latter puts me on curve-fitting watch once again; I will watch closely to see whether scope of conclusions are justified by data provided.
I immediately have a couple “parameter check” type questions (akin to first paragraph here). The highest total return in the previous sub-section utilized a 10-delta put sized to 100% loss. Here, she uses only a 16-delta put sized to max loss. On one hand, I’m happy she’s not just looking to curve-fit by presenting the best of the best. On another hand, I really want to see multiple permutations to avoid the possibility of fluke and to gain a broader perspective.
She starts out with the tenth “hypothetical performance growth” graph:
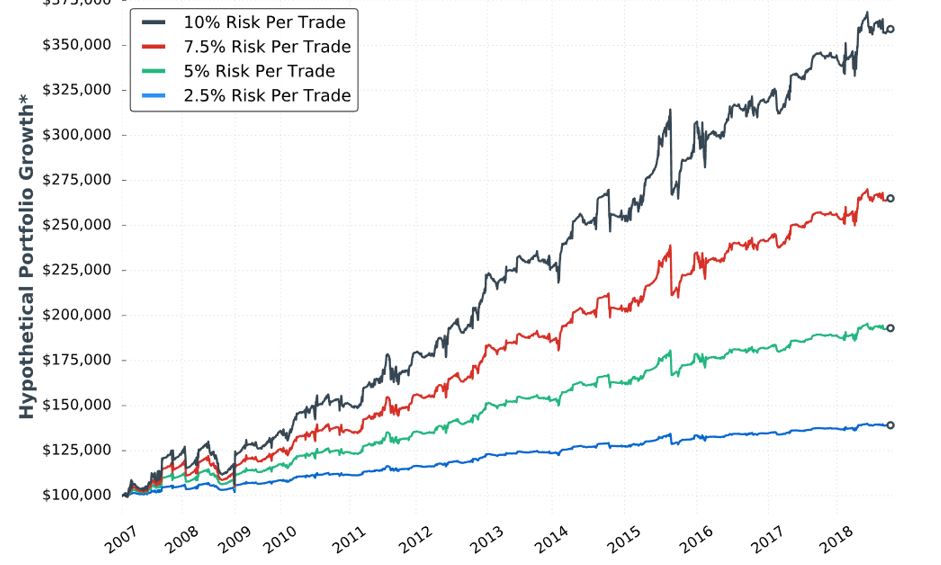
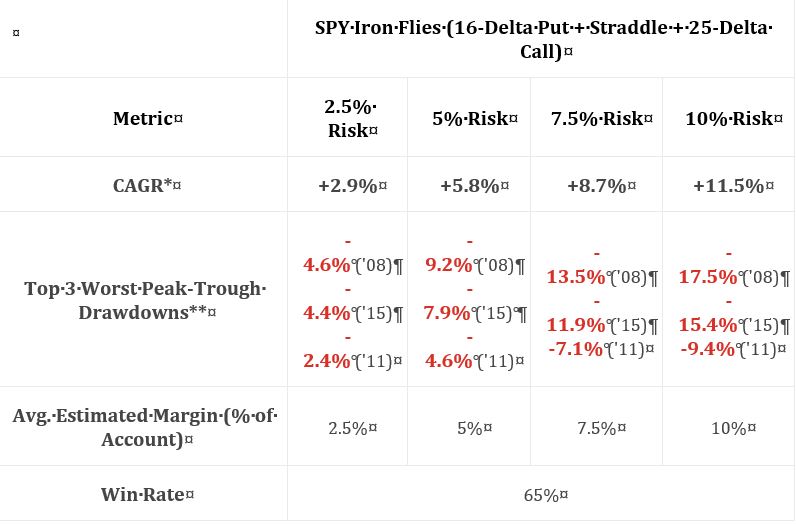
I appreciate the inclusion of CAGR and drawdowns in this table. I wish she had also included everything else the standard battery (see second paragraph of Part 19) provides.
Eyeing the graph and doing some simple math between columns of the table suggests these data to be relatively proportional to allocation. I calculated CAGR/MDD to be 0.630, 0.630, 0.644, and 0.657 for 2.5%, 5%, 7.5%, and 10% risk, respectively. Unlike the paragraph below the table here, these numbers align closer.
My commentary below the graph in Part 15 applies here as well. To repeat, I have questioned whether allocation is directly proportional to performance. Tasty Trade has done studies where allocation beyond a given critical value (~30%) results in an irreversible performance decline. Our author caps allocation at 10%. I would like to see allocation backtested at least high enough to see that supposed decline. This would provide important context about position size limitations.
She continues with a potentially apples-to-oranges comparison between results discussed in Part 15. I question the sizing approach. The Part 15 strategy is sized per 100% loss (i.e. credit received). As discussed in the third paragraph above, the strategy here is sized per max loss. To be consistent, I think she should have sized per 100% loss here, too. Looking at the graph in Part 18, it probably does not matter since the red and black curves both end up around $180,000. It would matter for the green and blue curves, however, which are significantly different.
I will continue detailing this comparison next time.
Categories: System Development | Comments (0) | Permalink