Short Premium Research Dissection (Part 15)
Posted by Mark on April 12, 2019 at 07:21 | Last modified: January 9, 2019 07:55The next sub-section addresses allocation with the eighth “hypothetical portfolio growth” graph:
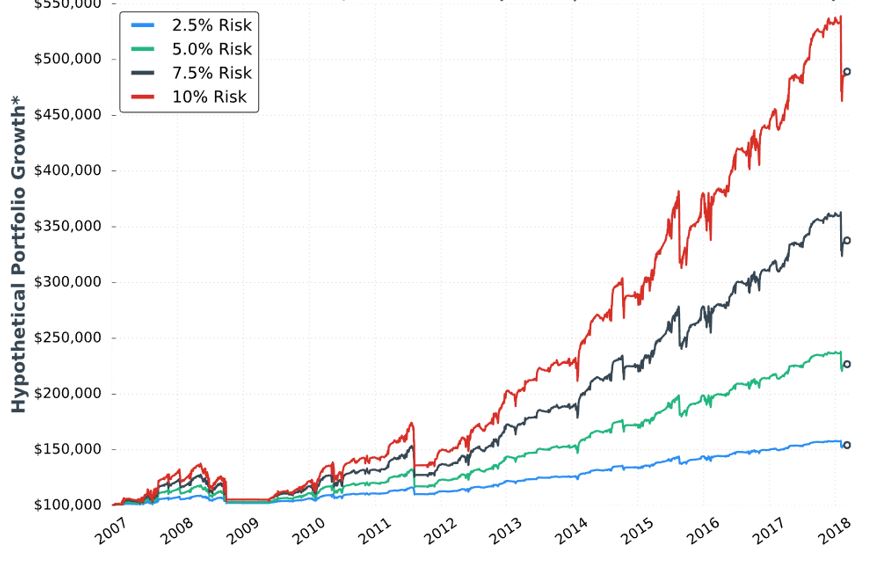
In my parameter checks (last done in this second paragraph), I have questioned whether allocation is directly proportional to performance. Tasty Trade has done studies where allocation beyond a given critical value (~30%) results in an irreversible performance decline. Our author caps allocation at 10%. I would like to see allocation backtested at least high enough to see that supposed decline. This would provide important context about position size limitations.
Our author provides the following statistics:

Everything is proportional in the table (e.g. values in the 10% allocation column are 4x those in the 2.5% allocation column) but not directly so (e.g. CAGR/MDD is 0.630, 0.628, 0.571, and 0.625, for 10% risk, 7.5% risk, 5% risk, and 2.5% risk respectively). I’d like some explanation why this is the case.
I think she did a decent job presenting statistics here. I like her presentation of the top three worst drawdowns (DD). She gives us CAGR too. I would still like to see the “standard battery” at the very least: distribution of DIT, complete distribution of losses including max/min/average [percentiles], average trade [ROI percentiles], average win, PF, max DD %, CAGR/max DD %, standard deviation (SD) winners, SD losers, SD returns, total return, PnL per day, etc.
She tells us the S&P 500 had CAGR near 8% (including dividends) during this time frame, which would only be realized with a 100% investment in the index. This 100% passive investment also incurred a max DD near -60% in 2008/2009. Whenever relevant, I would like to see an additional line on the graph corresponding to long shares. A similar control group was mentioned in the third-to-last paragraph here.
The author proceeds to give some discussion about margin requirement (MR), which I think is absurd. At the very least, she needs to explain “average estimated margin as a % of account” and how it is calculated. I last mentioned this in Part 9 with regard to buying power reduction. On a more advanced level, I would like to see some discussion of portfolio margin (see third paragraph). I never tracked MR in my own backtesting and have since found some occasions where MR > account equity (net liquidation value), which can signal a major problem.
Compounding the absurdity is the fact that maximum MR is even more important than average MR. Max MR is what determines whether I can continue to hold a position (as discussed in the fourth paragraph here). If max MR ever exceeds account value then I’m going to get a margin call and/or be forced to close the position. She should report max MR.*
* To determine contract size, Larry Williams once suggested dividing account value by
margin per contract plus 1.5 x most I would ever expect to lose.