Short Premium Research Dissection (Part 12)
Posted by Mark on April 1, 2019 at 05:52 | Last modified: December 7, 2018 11:10As it turns out, the table presented last time is prelude to a discussion of buying cheap OTM calls to cut upside risk.
She begins with this:
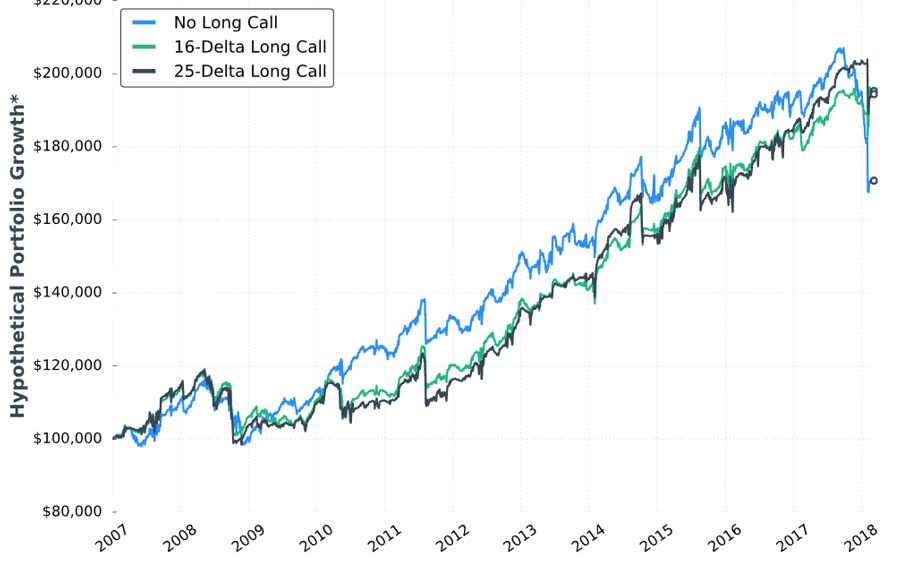
This is the fourth “hypothetical portfolio growth” graph presented thus far. I discussed my confusion over these in the second-to-last paragraph of Part 7. I continued by addressing the asterisk in the second paragraph of Part 8. Here we see that same asterisk but no corresponding footnote! I’m still hoping to get some context around “hypothetical portfolio growth.”
Looking at the graph, I question whether the long call is worth the cost. Although the long call lowers profit potential, the author writes it “eliminates the possibility of large losses if the market increases substantially.” Despite being in a bull market since 2009, the graph suggests the long call did not outperform until 2018 (right edge of the graph corresponds to February). Do we really want to pay all that money for insurance against a once-in-a-lifetime event? I would probably answer yes if I saw statistically significant differences in metrics I really want to know (see below).
Stepping back for a broader perspective, if we’re going to try and protect against an acute rally then surely there are once-in-a-lifetime downside events we should also try to protect against. I’m reminded of this third paragraph. The goal is never to find a separate Band Aid to cover everything: a sure indication of curve-fitting.
On a related note, as our author throws different conditions into the mix in an effort to improve the strategy, she gives us little perspective on how they compare with each other. I’ve made repeated mention of the fact that she does not include a thorough battery of trade statistics. Different people favor different metrics, but choosing a few common ones to include consistently with every backtest should satisfy most.
Here are the statistics presented in this sub-section:
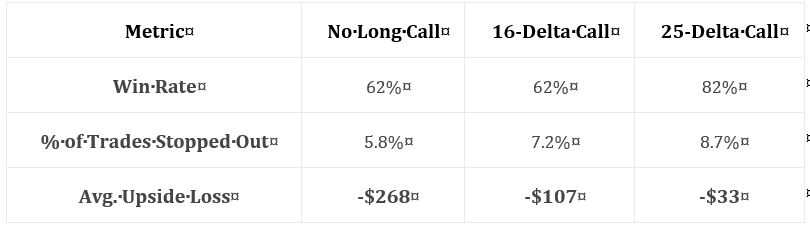
While these numbers are impressive, they leave too much to the imagination. In particular, I want to know how overall profitability is affected (e.g. average trade, profit factor). I want to know how standard deviation (SD) of returns is affected. I want to know how PnL per day is affected (DIT should be proportional). I want to see CAGR and CAGR / max DD %.*
The author emphasizes the markedly reduced drawdowns with long calls added. I wonder whether an indicator may be used as a trigger to buy the long call. I’d rather buy the long call 10% of the time, for example, rather than 100% of the time—especially when it’s only going to help me once every 10 years. Some ideas to be tested include a minimum momentum value, x-day high on the underlying, or others mentioned in the third-to-final paragraph here.
* The statistics I have listed multiple times include things like: distribution of DIT and losses including max/min/average
[percentiles], average trade [ROI percentiles], average win, PF, max DD %, CAGR, CAGR/max DD %, SD winners,
SD losers, SD returns, total return, PnL per day, etc.