Backtester Development (Part 6)
Posted by Mark on November 29, 2022 at 07:26 | Last modified: June 22, 2022 08:36Today I will continue discussion of logic for my revamped backtesting program.
The ‘find_spread’ control branch involves one of four paths:
- If DTE > 200 then continue.
- Elif dte_list empty, strike price multiple of 25, and strike price > underlying price by < 26, then store current_date and append option data to respective lists. At the end, the program will select two options for the spread based on available DTE. Since the iteration cannot go in reverse, potentially relevant data must be stored when encountered.
- Elif DTE matches previously-stored DTE then continue (implied is that the lists are no longer empty).
- Elif current_date still matches, then insert option data to beginning of respective lists (implied is that DTE has changed).
- Else update current_date and proceed with spread selection since iteration of all options from previous date is complete.
Motivation for requiring 25-point spreads relates to the fact that 5- and 10-point strikes were not available many years ago when option trading volume was much lower.* Even today, 25-point strikes are regarded as having the most volume and best liquidity. If true (this would be exceedingly difficult to test and may require huge amounts of capital to attain large sample sizes of live trades), then this criterion makes good sense.
Requiring 25-point spreads is not without controversy, however. If I include a penalty for slippage regardless of strike-price multiple, then I probably do not need the 25-point limitation. I think a bigger problem is nonuniform strike density, which I discussed in the fourth paragraph here.
Spread selection proceeds as a nested for loop over dte_list, which now has DTE values of matched strike-price options from the same historical date across increasingly farther-out expirations:
- First list position with value > (30 x mte) is the target short option; all related option data corresponding to this list position are now encoded as such.
- Iterate over remainder of dte_list to match first index position with value greater than S_dte + (27 x width)** as target long option; all related option data corresponding to this list position are now encoded as such.
These lists are my solution to the problem of dynamic variables described in Part 4. Rather than initializing multiple sets of variables to hold unnecessary data, data is stored in lists with each element corresponding to a particular DTE option. Once the proper DTEs are determined, corresponding values are then assigned to the only set of pre-initialized variables.
I will continue next time with the ‘update_long’ control branch.
*—2017 – 2021 option volume is shown here.
**—I am using 27 rather than 28 in case of a Friday holiday.
Generator Expressions and Iterators in Python
Posted by Mark on November 23, 2022 at 06:33 | Last modified: June 2, 2022 14:08After doing some further research, I have learned that my previous explanation of initializing multiple variables as empty lists was not very Pythonic. I want to correct some of that today.
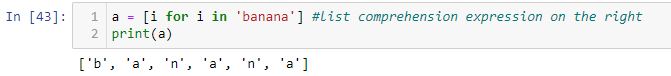
The following is a generator expression:
( [] for i in range(3) )
The expression will generate three empty lists. Parentheses are needed around generator expressions like brackets are needed around list comprehensions:
A generator is a function that returns an object also known as an iterator.
An iterator is an object that contains a countable number of values. An iterator may be iterated over one value at a time until all values have been exhausted. Trying to iterate further will then raise a StopIteration exception (i.e. error or traceback).
A generator expression is like a list comprehension except the latter produces the entire list while the former produces one item at a time. A generator expression has “lazy execution” (producing items only when asked for), which makes it more memory efficient than a list comprehension.
Although the end result is to initialize three variables as empty lists, Pythonically speaking this is doing something else:
list_a, list_b, list_c = ( [] for i in range(3) )
The right side is an object containing three items: [], [], and []. The left side unpacks that object into three respective variables. I went into detail about unpacking with regard to the zip() method in these two posts.
Last time, I may have described things as if something magical was going on. This is not magic. The parentheses on the right represent a generator object and the commas on the left are to unpack it.
With regard to my previous discussion about making sure to use commas rather than equals signs, the latter…
a = b = c = (1, 2, 3)
…is basically doing:
c = (1, 2, 3)
b = c
a = b
b and c both get assigned (1, 2, 3).
With regard to the generator expression from above, this…
a = b = c = ( [] for i in range(3) )
…is basically doing:
c = ( [] for i in range(3) )
b = c
a = b
Because c cannot be assigned three different lists from the generator, Python assigns the generator to the variable a (and b):
<generator object <genexpr> at 0x0000019F45352200>
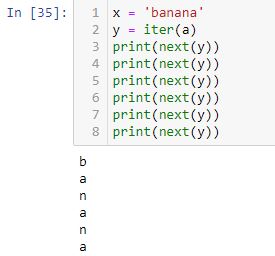
Lists, tuples, dictionaries, and strings are all iterable objects that have an iter() method used to return values. For example:
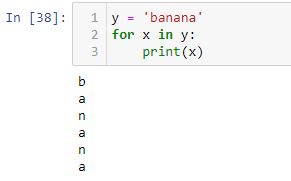
A for loop creates an iterator object, executes the next() method for each loop, and automatically stops at the end leaving us worry-free with regard to any potential [StopIteration] error:
Backtester Development (Part 5)
Posted by Mark on November 21, 2022 at 06:54 | Last modified: June 22, 2022 08:36I am extremely happy to say that since this post, I have revamped the Python code into what seems to be a properly working backtester! Today I will begin to review the logic.
While not easy, the process of dropping an existing framework into a slightly altered skeleton was not as difficult as once feared. When I first ran the revised program on a Wednesday afternoon, I wondered how many hours the debug process would take. I imagined it taking days! Previous experience had shown program fixes to not fix and when they do, to be followed by other things in need of fixing. Total debug time ended up being six hours. I had bugs, but I was able to seek and destroy.
One of my biggest struggles was organizing the variables. This literally made my head spin and kept me paralyzed for a good 60 minutes. I still don’t have a good solution except to say time working with the program breeds familiarity. I would still like to include all variables in a function and just call the function to reset and manage. That may not be practical. What I now have for variables is much different than the original key shown here. At some point, I should probably update that index.
For variable initiation and reset, I was able to condense code length by zeroing out multiple variables in a single line:
> var_a = var_b = var_c = var_d = 0
This is legit.
It took me a couple hours, however, to realize this is not:
> list_a = list_b = list_c = list_d = []
While the labels are different, each actually points to the same exact list. Changing any of them will result in a change to all, which was a real mess. A proper way to initiate multiple variables as separate lists is:
> list_a, list_b, list_c, list_d = ( [] for i in range(4) )
Precision is very important, too. The following does not yield the same result:
> list_a = list_b = list_c = list_d = ( [] for i in range(4) )
Instead of all pointing to an empty list, which is not even I wanted, done this way they all point to a generator object.
The first two paragraphs of Part 4 explain why I needed to revamp the program with regard to inconsistent DTE selection, etc. I will now proceed to describe the restructuring in words.
The basic backtesting approach remains as described in the third paragraph here. It will become evident why I was able to reduce the number of control branches to ‘find_spread,’ ‘update_long,’ and ‘update_short.’ The wait_until_next_day loop remains at the top albeit with more limited application in the current version (14).
I will continue next time.
Categories: Python | Comments (0) | PermalinkMED Stock Study (2-10-23)
Posted by Mark on November 18, 2022 at 06:38 | Last modified: March 7, 2023 14:27I recently* did a stock study on Medifast Inc. (MED) with a closing price of $109.45.
M* writes:
> Medifast Inc is a US-based company that produces, distributes
> and sells products concerning weight loss, weight management,
> and healthy living. The company generates its revenue from
> point of sale transactions executed over an e-commerce platform
> for weight loss, weight management, and other consumable
> health and nutritional products.
This [as of 2021] medium-sized company has grown sales and earnings at annualized rates of 17.3% and 30.6% over the last 10 years, respectively. Lines are mostly up and parallel except for a 2-3-year dip between ’14 and ’17. Since ’16, lines look more up, straight, and parallel. PTPM has increased from 6.9% in ’12 to 14.2% in ’21 with a last-5-year average of 13.8%. This just beats the industry average.
ROE has increased over the last 10 years from 17.6% to an eye-popping 82.1% and far outpaces industry averages. Zero long-term debt makes this even more impressive. Debt-to-Capital (as leases) over the last five years averages 6.4%, which is far below industry averages. Current Ratio is 1.49.
I assume long-term annualized sales growth of 5% based on the following:
- YF projects YOY 4.2% and 0.6% for ’22 and ’23, respectively, based on one analyst.
- Zacks projects 2.8% YOY growth and 0.7% YOY contraction for ’22 and ’23, respectively (one analyst).
- Value Line projects 5.6% annualized growth from ’21-’26.
I assume long-term annualized EPS growth of 4% based on the following:
- MarketWatch projects annualized contraction of 1.4% and 0.9% for ’21-’23 and ’21-’24, respectively, based on one analyst.
- Nasdaq.com projects 2% YOY growth and 3.3% growth per year for ’23 and ’22-’24, respectively [2, 2, and 1 analyst(s) for ’22, ’23, and ’24].
- YF projects 9.7% YOY contraction and 5.7% growth per year for ’22 and ’23, respectively (one analyst), along with 5-year annualized growth of 20%.
- Zacks projects 6.4% YOY contraction and 2% YOY growth for ’22 and ’23, respectively (two analysts).
- Value Line projects annualized growth of 4.6% from ’21-’26 and 12.3% from ’20-’26, but the latter may be [artificially high and] less meaningful as a result of base effects (i.e. a 60% YOY jump in ’21 EPS).
This is about as scant as analyst coverage can be, which makes long-term forecast difficult. I basically have 20% and 4.6%. Given one estimate, I might halve to get an acceptable margin of safety. With two, I am just using the lower number.
My Forecast High P/E is 17. Over the last decade, high P/E has ranged from 17 (’13) to 56.5 (upside outlier in ’18) with a last-5-year average (excluding the outlier) of 26.4. I am taking the low end of the range.
My Forecast Low P/E is 6. Over the last decade, low P/E has ranged from 5.6 (downside outlier in ’20) to 18.2 (’16) with a last-5-year average of 12.1. I am targeting the lower end of the range.
My Low Stock Price Forecast is the default value of $79.10. This is 27.7% below the previous closing price. It is also 17.6% below the 52-week low and 57% below the 2021 low.
All this computes to an U/D ratio of 5.4, which makes MED a BUY. The Total Annualized Return is 22.4%.
MED has a hefty dividend yield close to 6%. After dividend inception in ’15, Payout Ratio has ranged from 40.9% (’21) to 71.8% (’16) with a last-5-year average of 51.2%. I am forecasting below the entire range at 40%.
PAR is 14.5%, which is outstanding for a medium-sized company.
I use Member Sentiment (MS) to assess margin of safety (MOS) by getting some idea how likely the company may be to outperform my estimates. Out of 176 studies over the past 90 days (my own and 104 others with projected low prices above last closing price excluded), projected sales, projected EPS, Forecast High P/E, Forecast Low P/E, and Payout Ratio average 10%, 8.7%, 20.5, 11.2, and 50.1%, respectively. I am lower on all inputs. Value Line projects an average annual P/E of 20, which is higher than MS (15.8) and me (11.5). MOS seems healthy here.
MS Low Stock Price Forecast is $77.15—about 3% below mine. This would lower my U/D just a tad while effectively lowering the Forecast Low P/E, which I already selected to be sufficiently low.
As an aside, I’m surprised to see so many [now] invalid studies due to Low Stock Price Forecast > previous close. These studies are all from the past 90 days when MED traded no higher than $130.31. Forecast Low Stock Price is $130 or higher in 77 of those studies, which means they were invalid from the outset.
*—Publishing in arrears as I’ve been doing one daily stock study while posting only two blogs per week.
Backtester Development (Part 4)
Posted by Mark on November 15, 2022 at 06:54 | Last modified: June 22, 2022 08:36Despite my best efforts described near the end of this post and the beginning of that, the DTE combinations I was getting from the short and long legs were not what I wanted. Another mitigating factor is that depending on the cycle, options may not be available in the 120-150 DTE range. Today I will discuss what I have done to revamp the logic.
One thing I found is despite check_second, sometimes I actually needed to check a third. This made me realize I may not know exactly how many I need to check, which suggests a need for dynamically-created variables.
I’ve run up against this issue a number of times so it’s worth trying to describe a more general case and look for a solution.
Suppose I have a large data file and I don’t know how often a pattern will repeat. Each time it occurs, though, I need to capture details and later evaluate to select which one I’ll need.
What is the best way to name variables in this case?
One approach would be to define as many or more sets than I’ll ever need. For example:
> dte0 = dte1 = dte2 = dte3 = … = dte50 = 0
> row_num1 = row_num2 = row_num3 = … = row_num50 = 0
That seems like a pain.
I’d rather define and initialize the variables with a loop like:
> variable_set = [‘dte’+ str(i) for i in range(50)]
> print(variable_set)
Now I’ve got the variable names in a list… could I then initialize them as a loop?
This doesn’t work:
> for i in len(variable_set):
> int(variable_set[i]) = 0
>
> print(variable_set)
Even if that did work, I might have just changed the list to all zeros, which destroys variable names I might otherwise be able to use later in the program. I don’t know how to keep the strings as variable names for later use.
I think the solution is to use a list or dictionary and add values as needed. I can’t address particular values by unique names, but the logic in the program can dictate what values to retrieve by index/slicing and where to insert/delete the same way.
Here’s what I know:
- Short option should have at least 60 DTE.
- Long option should be next month out (for now).
- If I can identify the short option first then the long option will come easy.
- Iterating down the file means going from longer-term to short-term options, which makes this more complex.
The new solution is to encode any necessary data for options 200 DTE or lower at the proper strike price and put them in lists (e.g. dte_list, orig_price_list, orig_delta list, etc.).
Each time DTE changes, as long as historical date remains the same I will encode new data for the proper strike price. Instead of appending values to the end of lists, I will insert at the beginning.
The time to identify the spread is once historical date changes. dte_list then includes DTE of all available options on that historical date in ascending order. I can then iterate through the dte_list from beginning to end. If the value > 60 then I have found my short option and the long option will be next (for width = 1). I can then assign the appropriate values from each list to specific variable names like those listed in the key.
Categories: Python | Comments (0) | PermalinkFIVE Stock Study (2-9-23)
Posted by Mark on November 10, 2022 at 07:26 | Last modified: March 6, 2023 13:34I recently* did a stock study on Five Below Inc. (FIVE) with a closing price of $199.04.
Value Line writes:
> Five Below, Inc. offers a broad range of merchandise targeted
> to the teen and pre-teen customer. Most products are priced
> at $5 or below, with some in the $6-$10 range (Five Beyond).
> Products are in the following category worlds: Style, Room,
> Sports, Tech, Create, Party, Candy, and Now.”
This medium-sized company has grown sales and earnings at annualized rates of 22.5% and 26.6% over the last 10 and nine (excluding a loss in ’12) years, respectively. Lines are mostly up, straight, and parallel except for an EPS decline in ’20. PTPM over the last decade has ranged from 7.8% (’20) to 12.9% (’21) with a last-5-year average of 11.5%. This is higher than peer and industry averages.
ROE has fallen from 35.9% (’13) to 26.7% (’21) with a last-5-year average of 25%, which is better than peer and industry averages. The debt-to-capital ratio has averaged 33% over the last five years, which is lower than peer and industry averages. FIVE has zero total debt and a Current Ratio of 1.5.
I assume long-term annualized sales growth of 12% based on the following:
- CNN Business projects 10.7% YOY and 13.4% per year for ’22 and ’21-’23, respectively (based on 23 analysts).
- YF projects YOY 7.4% and 17.2% for ’23 and ’24, respectively (23 analysts).
- Zacks projects YOY 7.4% and 17.4% for ’23 and ’24, respectively (9).
- Value Line projects 17.9% annualized from ’21-’26.
- CFRA projects 7.1% YOY and 12% per year for ’23 and ’22-’24, respectively.
- M* provides a 2-year ACE of 12.4% and a 10-year estimate of 13% (analyst note).
I assume long-term annualized EPS growth of 17.3% based on the following:
- CNN Business projects a 5.5% YOY contraction and 6.7% growth per year for ’22 and ’21-’23, respectively (based on 23 analysts), along with a 5-year annualized growth rate of 20.5%.
- MarketWatch projects annualized rates of 6.7% and 11.7% for ’22-’24 and ’22-’25, respectively (26 analysts).
- Nasdaq.com projects annualized rates of 20.6% and 25.7% for ’23-’25 and ’23-’26, respectively [8, 6, and 1 analyst(s) for ’23, ’24, and ’25].
- Seeking Alpha projects 4-year annualized growth of 24.8%.
- YF projects YOY 5.5% contraction and 20.7% growth for ’23 and ’24, respectively (24), along with 5-year annualized growth of 12.2%.
- Zacks projects YOY 5.5% contraction and 20.1% growth for ’23 and ’24, respectively (11), along with a 5-year annualized growth rate of 19%.
- Value Line projects annualized growth of 17.3% from ’21-’26.
- CFRA projects 6.9% YOY contraction and 6.9% growth per year for ’23 and ’22-’24, respectively, along with a 3-year annualized growth rate of 37% [after inquiring, CFRA changed this to NMF due to misleading base effects].
- M* provides a long-term estimate of 18.3%.
2022 earnings are in decline and because I believe this to be an isolated event, I will look to exclude the recent quarters. I can do this by projecting from the 2021 data point with my desired 13% growth rate. This is equivalent to projecting from the last quarterly data point ($4.11/share) with a 17.3% growth rate. Doing the latter keeps with the default approach, which will probably be more commonly applied in Member Sentiment (see MS below) studies.
While this type of manual override is more aggressive than my usual methodology, I am still lower than all but one (YF) of six long-term analyst estimates (mean 19.5%).
My Forecast High P/E is 36. Since 2013, High P/E has ranged from 39.5 (’15) to 93.7 (’13) with a last-5-year average of 55.3. I expect that to come down to earth at some point.
My Forecast Low P/E is 25. Since 2013, Low P/E has ranged from 20.2 (’17) to 58.7 (’13) with a last-5-year average of 25.1. I would typically project 20 in such a case, but I’m electing to be more aggressive.
My Low Stock Price Forecast is the default value of $102.80. Although more than the 20% “rule of thumb” below the previous closing price [-48%], I think it reasonable being only 6.1% less than the 52-week low. Raising the Low Stock Price Forecast would effectively be raising the Forecast Low P/E, which is already at my upper limit of comfort.
All this computes to an U/D ratio of 1.3, which makes FIVE a HOLD. The Total Annualized Return (TAR) computes to 10.5%.
PAR, which is based on Forecast Average (not High) P/E, is 6.9%: lower than I want to see for a medium-sized company.
I use MS to assess margin of safety (MOS) by getting an idea how likely the company may be to outperform my estimates. Out of 345 studies over the past 90 days (my own and two others with projected low prices above last closing price excluded), projected sales, projected EPS, Forecast High P/E, and Forecast Low P/E average 15.2%, 16.1%, 39.2, and 25, respectively. My inputs are not substantially different, which means my study has negligible MOS. Value Line projects an average annual P/E of 30, which is just lower than mine (30.5) and lower than MS (32.1).
I will look to revisit FIVE under $159/share.
*—Publishing in arrears as I’ve been doing one daily stock study while posting only two blogs per week.
Backtester Development (Part 3)
Posted by Mark on November 7, 2022 at 07:07 | Last modified: June 22, 2022 08:36In moving forward to eliminate the lower bound, I encountered a bug described at the end of Part 2. Today I want to finish discussing my debugging effort.
I tried all kinds of things during the next three hours. I can’t remember the exact order of what I tried or even the results of everything I did.
The bug occurred before the dataframe was printed to .csv file, which prevented me from viewing in Excel. I was able to display in JN, and that helped immensely. This revealed a long option with 28 DTE at trade inception. Of course that’s going to be a problem because it means the short option would be 0 DTE and missing upon subsequent update. I later noticed many missing short options, which I never understood.
Before looking at the dataframe, I added lines in the program to print different things as a way to track footprints. I needed to better understand what branches the program traveled through. In order to see the log file, I had to enter in JN:
> strike_file.close()
Because the ValueError occurred before the program completed, the results file remained open in Python. Closing it manually with this line made viewing the log file easier. After studying the log file and making changes, I learned to close the log file to avoid an error upon subsequently running the program again (PermissionError: [Errno 13] Permission denied).
Printing out different variables helped to determine where the bug arose and what steps the program took to get there. The list of variables I looked at grew long:
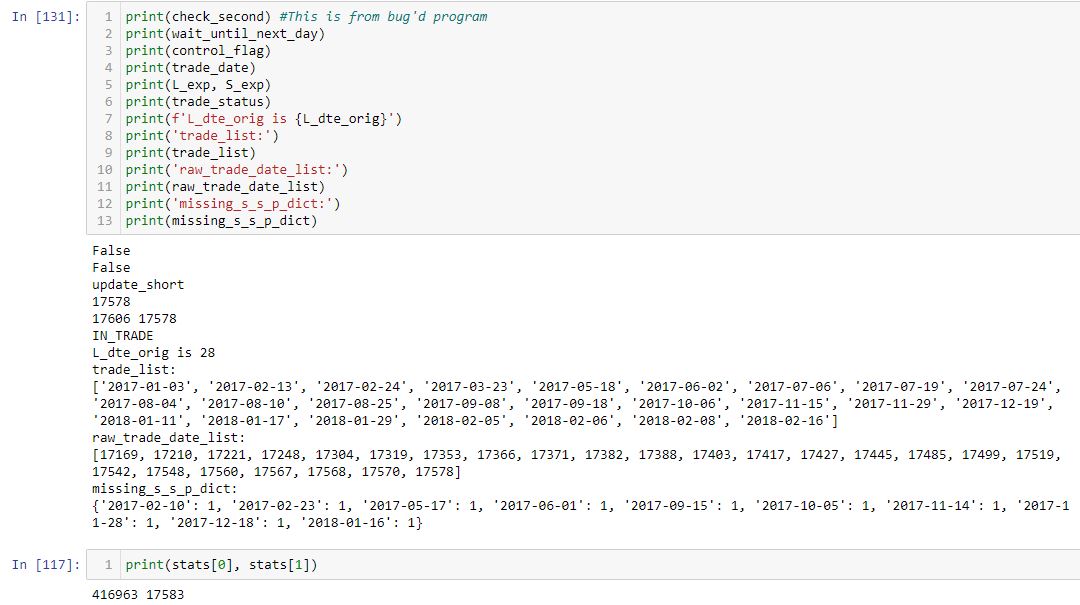
I even had to create some new variables to better interpret the old ones. raw_trade_date_list is one example because the data file—something I studied to understand on what row the program stopped due to error—shows the raw date rather than a more familiar format (see end of this post for explanation).
In many places, I inserted counters to determine how many times the program executed particular branches. This line proved particularly useful because it creates a detailed log of variables upon every iteration:
![]()
My debugging effort had many fits and starts because I would find something that seemed like a smoking gun only to make changes and see the bug remain. I became saddled with contradictory information. For example, assignment to current_date meant the program executed one branch while so-and-so flag True meant the program couldn’t have executed said branch.
I eventually noticed an instance of == when it should have been = . This led me to do a search for equals signs and verify every single one of over 350 in the code. This revealed:
- L142: control_flag == ‘find_long’ #NEEDS TO BE SINGLE = NOT ==
- L183: wait_until_next_day == True #NEEDS TO BE SINGLE = NOT ==
- L265: control_flag == ‘find_long’ #NEEDS TO BE SINGLE = NOT ==
- L266: wait_until_next_day == True #NEEDS TO BE SINGLE = NOT ==
See a pattern here? Clearly I need to improve with regard to usage of = versus == .
With these all fixed, the program runs as expected even without the lower bound.
Mission [finally] accomplished!
Categories: Python | Comments (0) | PermalinkOLLI Stock Study (2-8-23)
Posted by Mark on November 4, 2022 at 07:00 | Last modified: March 5, 2023 13:30I recently* did a stock study on Ollie’s Bargain Outlet Holdings (OLLI) with a closing price of $56.75.
M* writes:
> Ollie’s Bargain Outlet Holdings Inc is a retailer of brand name
> merchandise at drastically reduced prices. It offers customers a
> selection of brand name products, including housewares, food,
> books and stationery, bed and bath, floor coverings, toys, and
> hardware. It operates stores across the Eastern half of the
> United States. Its differentiated go-to-market strategy is
> characterized by a unique, fun and engaging treasure hunt
> shopping experience, compelling customer value proposition and
> witty, humorous in-store signage and advertising campaigns.
> These attributes have driven rapid growth and strong and
> consistent store performance for the company.
This medium-sized company has grown sales and earnings at annualized rates of 16.9% and 32.4%, respectively, over the last nine years. Lines are mostly up, straight, and parallel until 2021 when sales dipped and EPS started to fall. Over the last 10 years, PTPM has been higher than peer (stated as PSMT, DOL.TO, and BIG) and industry averages, increasing from 5.7% in ’13 to 15.4% in ’20 before starting to decline. The last-5-year average is 12.9%.
Since 2015, ROE has increased from 7% to 19% (’20) before heading lower. The last-5-year average is 15.2%, which is lower than peer and industry averages. The debt-to-capital ratio has fallen from 37.7% in ’13 to 25.1% in ’21. This is just over the last-3-year average and lower than peer and industry averages. Long-term debt is minuscule with most debt being uncapitalized leases. Current ratio is 2.83.
I assume long-term annualized sales growth of 5% based on the following:
- CNN Business projects flat YOY and 5.4% growth per year for ’22 and ’21-’23, respectively (based on 15 analysts).
- YF projects YOY 3.8% and 9.9% for ’23 and ’24, respectively (15 analysts).
- Zacks projects YOY 3.8% and 10.6% for ’23 and ’24, respectively (6).
- Value Line projects 9.8% growth per year from ’21-’26.
- CFRA projects 3.8% YOY and 7% per year for ’23 and ’22-’24, respectively (14).
- M* provides a 2-year annualized estimate of 7.8%.
I assume long-term annualized EPS growth of 6% based on the following:
- CNN Business projects a 33.1% YOY contraction and 0.2% growth per year for ’22 and ’21-’23, respectively (based on 15 analysts) along with 5-year annualized growth of 0.5%.
- MarketWatch projects 0.9% and 7.1% growth per year for ’22-’24 and ’22-’25, respectively (20 analysts).
- Nasdaq.com projects 49.4% YOY and 32.2% per year for ’24 and ’23-’25, respectively (7, 7, and 3 analysts).
- Seeking Alpha projects 5-year annualized growth of 15.8%.
- YF projects YOY 33.1% contraction and 50% growth for ’23 and ’24, respectively, along with 5-year annualized growth of 7.5% (15).
- Zacks projects YOY 33.1% contraction then 49.4% growth for ’23 and ’24, respectively, along with 5-year annualized growth of 12.1% (7).
- Value Line projects 13.8% annualized growth from ’21-’26.
- CFRA projects YOY 35% contraction and 0.6% contraction per year for ’23 and ’22-’24, respectively (14).
While my forecast is lower than the average of five longer-term growth rates (10.5%), I am overriding projection from the last annual (not quarterly) data point. The latter is a more aggressive calculation.
My Forecast High P/E is 29. Over the last seven years, high P/E has ranged from 29.8 (’17) to 48.1 (’19) with a last-5-year average of 39.8.
My Forecast Low P/E is 15. Over the last seven years, low P/E has ranged from 7.8 (potentially a downside outlier in ’20) to 24.7 (’18 and ’19) with a last-5-year average (excluding the 7.8) of 20.6.
My Low Stock Price Forecast is $36.50 based on the annual (not quarterly) earnings as mentioned above. This is just below the 52-week low price and 35.7% below the previous closing price.
All this results in an U/D ratio of 1.9, which makes OLLI a HOLD. The Total Annualized Return (TAR) computes to 10.7%.
PAR is 4.7%, which is lower than desired for a medium-sized company.
To assess margin of safety (MOS), I compare my inputs with those from Member Sentiment (MS). Out of 200 studies over the past 90 days (excluding my own along with 14 others with Low Stock Price Forecast above last closing price), projected sales, projected EPS, Forecast High P/E, and Forecast Low P/E average 10.9%, 11.8%, 31.1, and 18.3, respectively. I am lower on all inputs. Value Line projects an average annual P/E of 24, which is slightly lower than MS (24.7) but higher than mine (22).
Overall, I appear to have a decent MOS built into this study, but I need to see the stock fall ~10% before considering a purchase for longer-term investment
*—Publishing in arrears as I’ve been doing one daily stock study while posting only two blogs per week.
Backtester Development (Part 2)
Posted by Mark on November 1, 2022 at 07:24 | Last modified: June 22, 2022 08:36I resume today with my detailed approach to check_second, which I provided at the end of Part 1.
In case you had trouble following all that, I concur because it’s a mess! check_second increases the find_long branch from 17 to 45 lines. In the process, I encountered a bug that took over two hours to identify.*
I also had great difficulty in keeping track of indentation:
Getting the indentation wrong can screw up a program something fierce. I really need to think carefully about what’s going to happen where depending on how the conditional criteria evaluate.
Even getting the indentation correct, I am not entirely happy with the solution. I feel it’s sloppy Python, but I may not know any better at this point. The elapsed time is about three seconds longer, but I feel more confident that nothing will slip through the cracks. Perhaps a couple user-defined functions would make the nested ifs more readable.
Starting an ELSE with the same indentation whenever I begin an if statement might also help the effort. This will allow me to more easily see the proper indentation up front even if I don’t have it filled in yet. When there is nothing to do in the ELSE branch, I can always use PASS. All this is to make the code more readable, which I’m guessing would be advised by PEP 8 (Python style guide), and to decrease the risk of sloppy mistakes.
To that end, my next steps were to eliminate the redundant 10-multiple truth tests and to make sure every if has a corresponding ELSE statement. In most cases for this program, the ELSE block simply gets CONTINUE to move to the next iteration (row of data file). I am encouraged to say no bugs were encountered at this stage, which added 10 lines and included quite a bit of code manipulation aided by the Atom editor folding feature (see footnote here).
Maybe I can do right in Python after all! I also feel much better about the code with things seemingly better organized.
This confidence boost was very short-lived, however, as my next step to eliminate the lower bound (see fifth paragraph here for a refresher) resulted in the previous day’s check_second bug profile all over again:
I will discuss this more next time.
*—Incidentally, the bug was in (2) because at the bottom of find_long, I assigned find_short to control_flag.
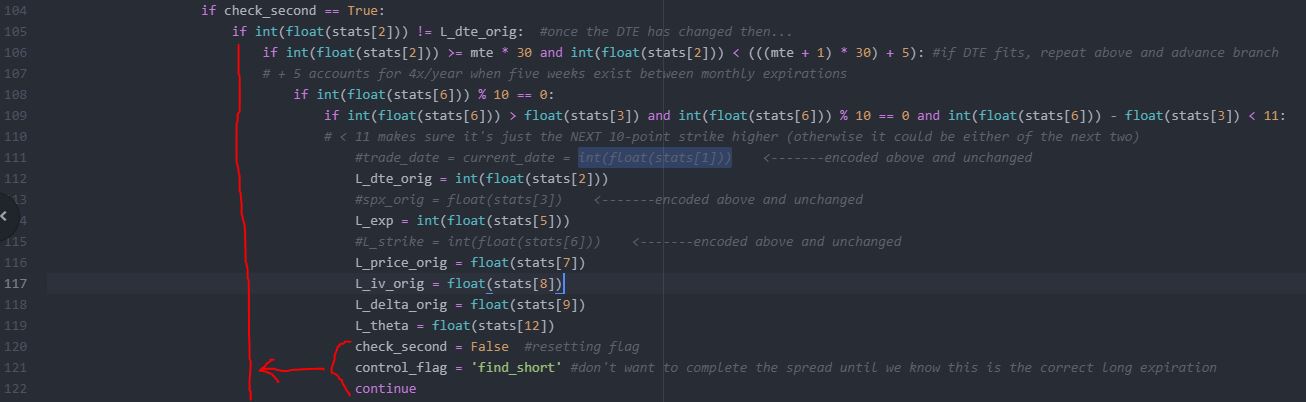
The whole idea of check_second is to hold off on taking steps to completing the spread (find_short) until
verifying the first qualifying DTE to be the only (else I want the shorter DTE).
GNRC Stock Study (2-6-23)
Posted by Mark on October 27, 2022 at 06:40 | Last modified: March 2, 2023 14:33I recently* did a stock study on Generac Holdings Inc. (GNRC) with a closing price of $122.44.
M* writes:
> Generac Power Systems designs and manufactures power generation
> equipment serving residential, commercial, and industrial markets.
> It offers standby generators, portable generators, lighting,
> outdoor power equipment, and a suite of clean energy products.
This medium-sized company has grown sales and earnings at annualized rates of 11.2% and 18.6%, respectively, over the last 10 years. Lines are mostly up and parallel except for sales/EPS declines in ’14 and ’15 along with EPS decline in recent quarters. PTPM has been cyclical—ranging from 9.3% (’15) to 18.8% (’13) with a last-5-year average of 15.7%. This is higher than peer (stated as SPXC, IR, and GTES) and industry averages.
Excluding an upside outlier of 66.9% in ’13, ROE has ranged from 15.1% (’15) to 38.3% (’14) with a last-5-year average of 30%. This leads peer and industry averages. Debt-to-Capital has trended lower since 2012 from 65.8% to 37.4% with a last-5-year average of 49.1%. This is mostly higher than peer and industry averages. Interest Coverage is 14 and Current Ratio is 2.1 (sans inventory, the Quick Ratio is 0.70).
I assume long-term annualized sales growth of 7% based on the following:
- CNN Business projects growth of 24.3% YOY and 6.5% per year for ’22 and ’21-’23, respectively (based on 20 analysts).
- YF projects 22.5% YOY growth and 8.6% YOY contraction for ’22 and ’23, respectively (22 analysts).
- Zacks projects YOY growth of 22.7% and YOY contraction of 7.1% for ’22 and ’23, respectively (7).
- Value Line projects annualized growth of 18.4% from ’21-’26.
- CFRA projects growth of 24% YOY and 15.2% per year for ’23 and ’22-’24, respectively.
- M* provides a 2-year growth estimate of 7%.
I assume long-term annualized EPS growth of 5% based on the following:
- CNN Business projects contraction of 12.5% YOY and 13.4% per year for ’22 and ’21-’23, respectively (based on 20 analysts) along with 5-year annualized growth of 10%.
- MarketWatch projects contraction of 13.2% and 4% per year for ’21-’23 and ’21-’24, respectively (25 analysts).
- Nasdaq.com projects annualized growth of 2.1% and 5.4% for ’22-’24 and ’22-’25, respectively (7, 10, and 3 analysts).
- Seeking Alpha projects 5-year annualized growth at 10%.
- YF projects YOY contraction of 10.9% and 15% for ’22 and ’23, respectively, along with 5-year annualized contraction of 1.4% (22).
- Zacks projects YOY contraction of 11.7% and 14.2% for ’22 and ’23, respectively, along with 5-year annualized growth of 10% (11).
- Value Line projects annualized growth of 20.4% from ’21-’26.
- CFRA projects 2.9% YOY contraction and 2.7% growth per year for ’23 and ’22-’24, respectively, along with a 3-year annualized growth of 12%.
- M* gives a long-term annualized growth ACE of 6.7%.
My projected growth rate is somewhat of a compromise. Seeing that ’22 is not complete, my guess is that analyst long-term estimates are based on the last annualized number. As this effectively raises the High Stock Price Forecast, I will do so with a lower growth forecast: 5% rather than 6%.
My Forecast High P/E is 22. Over the last 10 years, high P/E has ranged from 17.1 (’18) to 63.2 (upside outlier in ’21) with a last-5-year average (excluding the outlier) of 26.7.
My Forecast Low P/E is 12. Over the last 10 years, low P/E has ranged from 12 (’19) to 26.8 (upside outlier in ’21) with a last-5-year average (excluding the outlier) of 12.8.
My Low Stock Price Forecast of $79.80 is the default value. This is about 35% below the last closing price and 7.5% lower than the 52-week low price.
All this results in an U/D ratio of 2.6, which makes GNRC a HOLD. The Total Annualized Return (TAR) computes to 13.7%.
PAR is 8%, which is a bit lower than I’d like to see for a medium-sized company.
I use member sentiment (MS) to assess margin of safety (MOS) in deciding how likely it is that TAR rather than PAR can be realized. Out of 378 studies over the past 90 days (excluding my own along and 50 others with invalid low prices), projected sales growth, projected EPS growth, Forecast High P/E, and Forecast Low P/E average 11%, 12%, 24.8, and 14.3, respectively. I am lower on all inputs. Value Line’s estimate, perhaps the most optimistic of all, seems like an upside outlier. They project a future average annual P/E of 27.5, which far outpaces my 17 and is also higher than MS 19.5.
MOS appears to be alive and well in this study.
MS Low Stock Price Forecast is $84.33: 5.7% above my own. This is not unreasonable and would put me just on the cusp of the BUY zone. I am sticking with my Forecast Low P/E, however, which results in a HOLD on these shares at $118 or higher.
*—Publishing in arrears as I’ve been doing one daily stock study while posting only two blogs per week.