Debunking the Williams Hedge (Part 4)
Posted by Mark on September 7, 2021 at 06:51 | Last modified: June 8, 2021 12:05Today I will continue discussion of the Williams Hedge (WH), which I introduced here.
To better understand the consequences of backwardation, take a look at the following table:
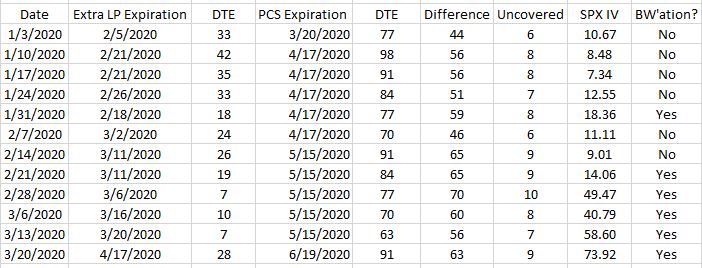
Shown here are the expiration dates of the extra long put (LP) and put credit spread (PCS, in second and fourth columns, respectively) along with days to expiration (third and fifth columns, respectively). “Difference,” in the sixth column, subtracts LP DTE from PCS DTE. “Uncovered” divides Difference by seven and rounds down to convert to number of weeks, which reflects number of uncovered PCS tranches (sold once weekly). The last column indicates backwardation (BW) or lack thereof.
We can see a gradual increase in the Difference column over time. Difference starts out at 44, which is about what I suggested in the fourth-to-last paragraph of Part 3. The first three Difference entries average 52 DTE while the last three average 60 DTE: an increase of eight, which is one additional uncovered tranche.
BW seems to be correlated with higher Difference values. Hypothesis #1: higher SPX IV tends toward BW but is not always coincident with it. To the contrary, the table indicates BW whenever SPX IV > 12.55. Hypothesis #2: increases in SPX IV not corresponding to changes in term structure should not affect Difference as much (if at all). The data seem to support this. Difference ranges from 44 to 65 (56 to 70) for contango (BW). Mean Difference is 53 vs. 62 for contango and BW, respectively. If the 7 DTE LP is selected on Mar 20 (coming attractions), then mean Difference in BW is 66.
This analysis is imperfect partly due to differing granularity of expiration cycles. The long-dated PCS are implemented in monthly expirations, which means shifting expiration contributes +21 or +28 to Difference from one week to the next. The LPs are able to be placed in weekly expirations. When these shift expirations, they do so in a more granular fashion since weekly expirations are available every 1-3 days. This explains apparent discrepancies like why Difference increases from 1/3/20 to 1/10/20 (or 1/17/20) with SPX IV lower (also consistent with my hypothesis #2, above).
Another reason the analysis is imperfect is outlier vulnerability due to small sample size. The backtest only has 12 data points and Mar 20 may be an outlier. Mar 20 has the highest level of SPX IV. In placing the WH on this day, market crash conditions result in wide bid/ask forcing us NTM to the 800 strike for requisite PCS credit (IV > 105%) after slippage. We then search for the longest-dated put at strike 800 or higher with premium < $0.45 and find the 28 DTE Apr 17 800 put (IV 120%).
Why 28? This even looks out of place in the table where third-column values read 19, 7, 10, 7, 28. The high DTE value results in a Difference of 63. Given SPX IV ~74, why is not larger?
I will continue next time.
Categories: Backtesting | Comments (0) | Permalink