Debunking the Williams Hedge (Part 7)
Posted by Mark on September 16, 2021 at 06:40 | Last modified: June 11, 2021 08:21Today I will continue discussion of the Williams Hedge (WH), which I introduced here.
I left off with this table at the bottom that encompasses much of what I have been discussing in the current mini-series. I did not include the 7 DTE $0.05 teenies, which would adjust every value in the table by +1 except for 3/13/20 and 3/20/20 where I did not purchase (see below). Notice how PCS tranches become uncovered as the LP start to expire. Also note how the lack of coverage accelerates after SPX IV goes into backwardation. The course says nothing about this.
In backtesting the WH, I observed when SPX IV got high, I had to go below the PCS short strike to buy the 7 DTE teeny for $0.05. This happened in the last two backtested weeks. Thinking my desired margin control would not be achieved, I skipped the purchase altogether and thought the strategy to be flawed because the course does not address it.
After doing some modeling in OptionNet Explorer (ONE), I realize this was an oversight on my part.
The purpose of these teenies is to protect portfolio margin (PM). I have discussed PM here and here. Basically, the lowest point on the day step curves within +/- 15% (varies by broker) of current market price cannot exceed account net liquidation value.
A PCS risk graph looks like this:
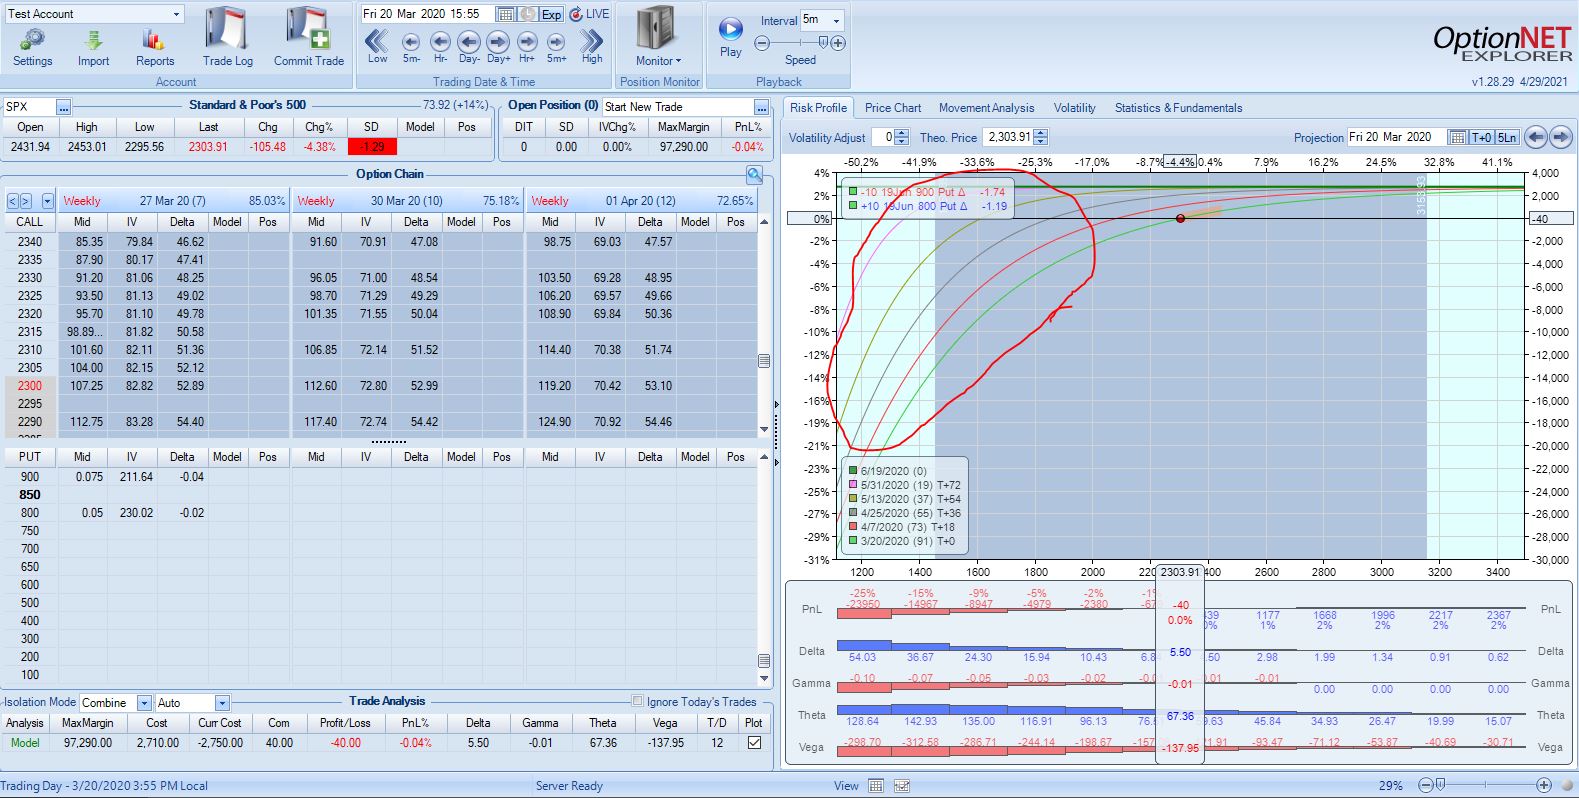
Notice how the day steps, circled in red, all slope down to the left. The position loses more and more money as the market falls. If the loss at 15% down on the underlying is too large, then I will get a margin call from my broker telling me to close positions or deposit more money. This is what we want to avoid.
Below are examples of teenies purchased with 7 DTE at/above PCS short strike in Jan 2020 and Mar 2020:
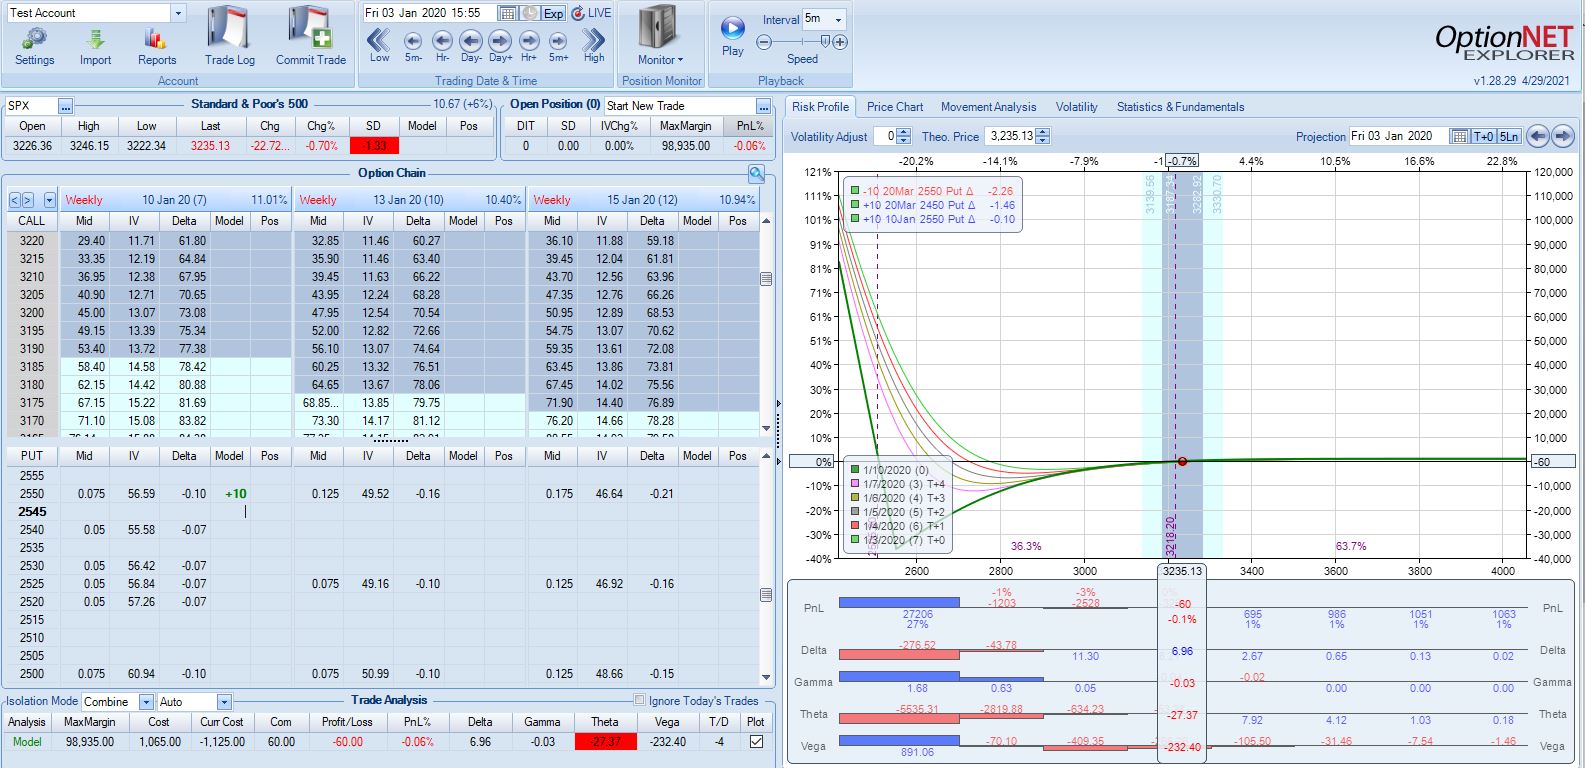
Notice the day steps slope up to the left and the lowest they fall is -20% for the beige line on the second graph. A loss of 20% is nowhere close to margin call territory. Furthermore, this -20% corresponds to a ~50% market decline (see numbers across top of graph) whereas PM looks down only 15%. The teenies have definitely served their purpose.
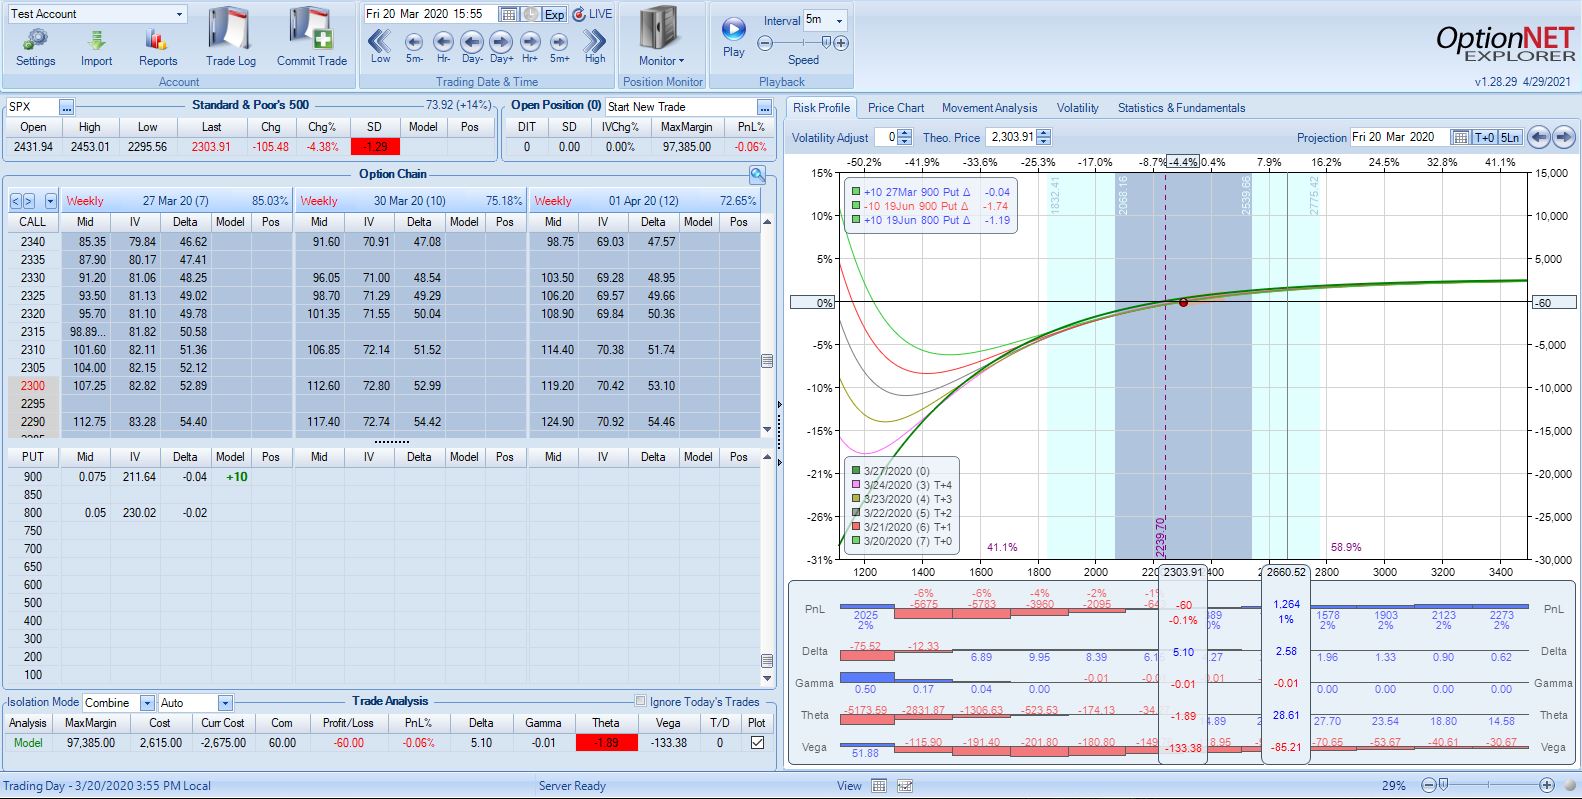
Here are the same examples with 7 DTE teenies purchased below the PCS short strike:
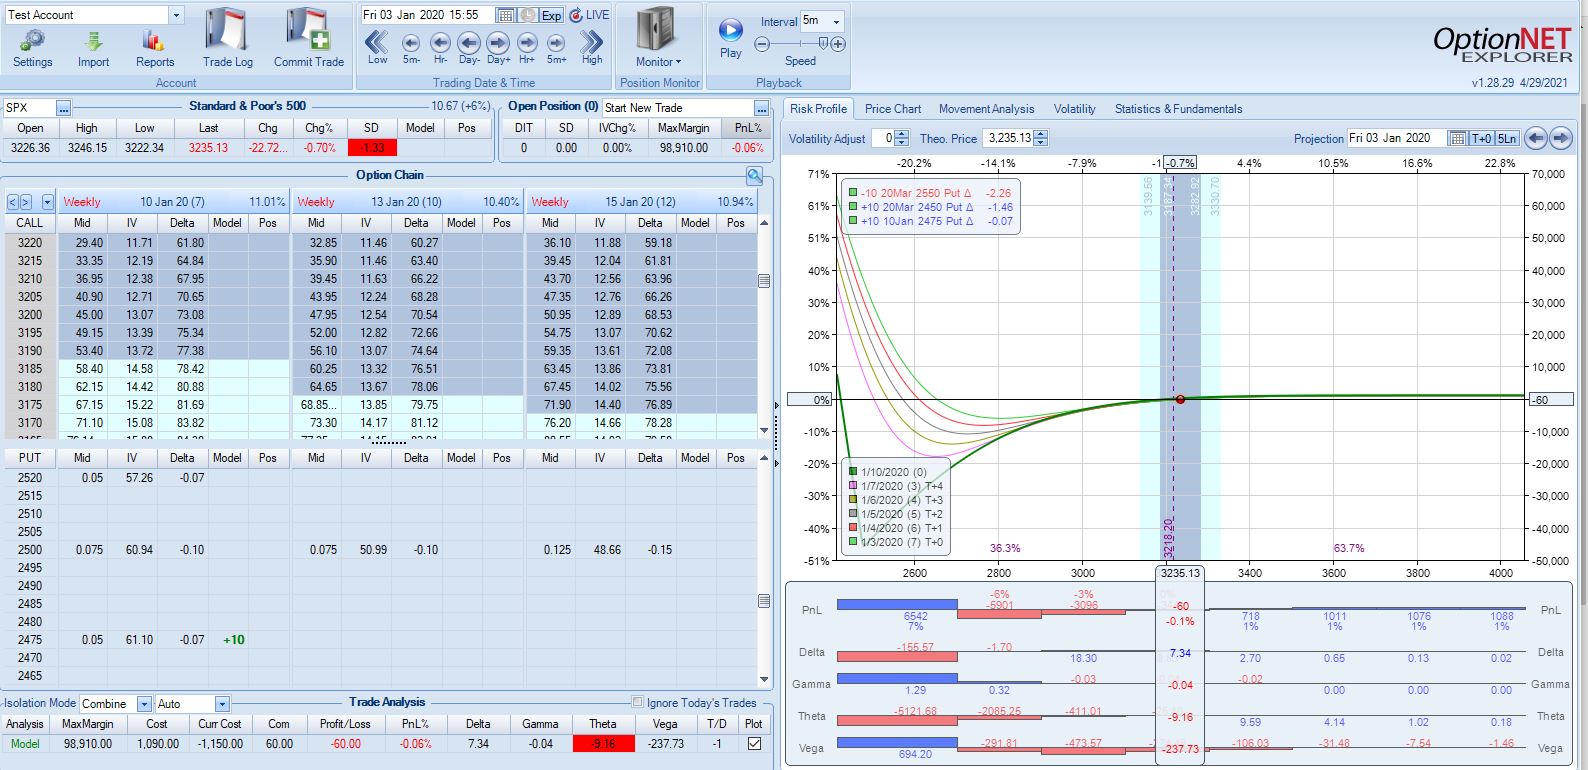
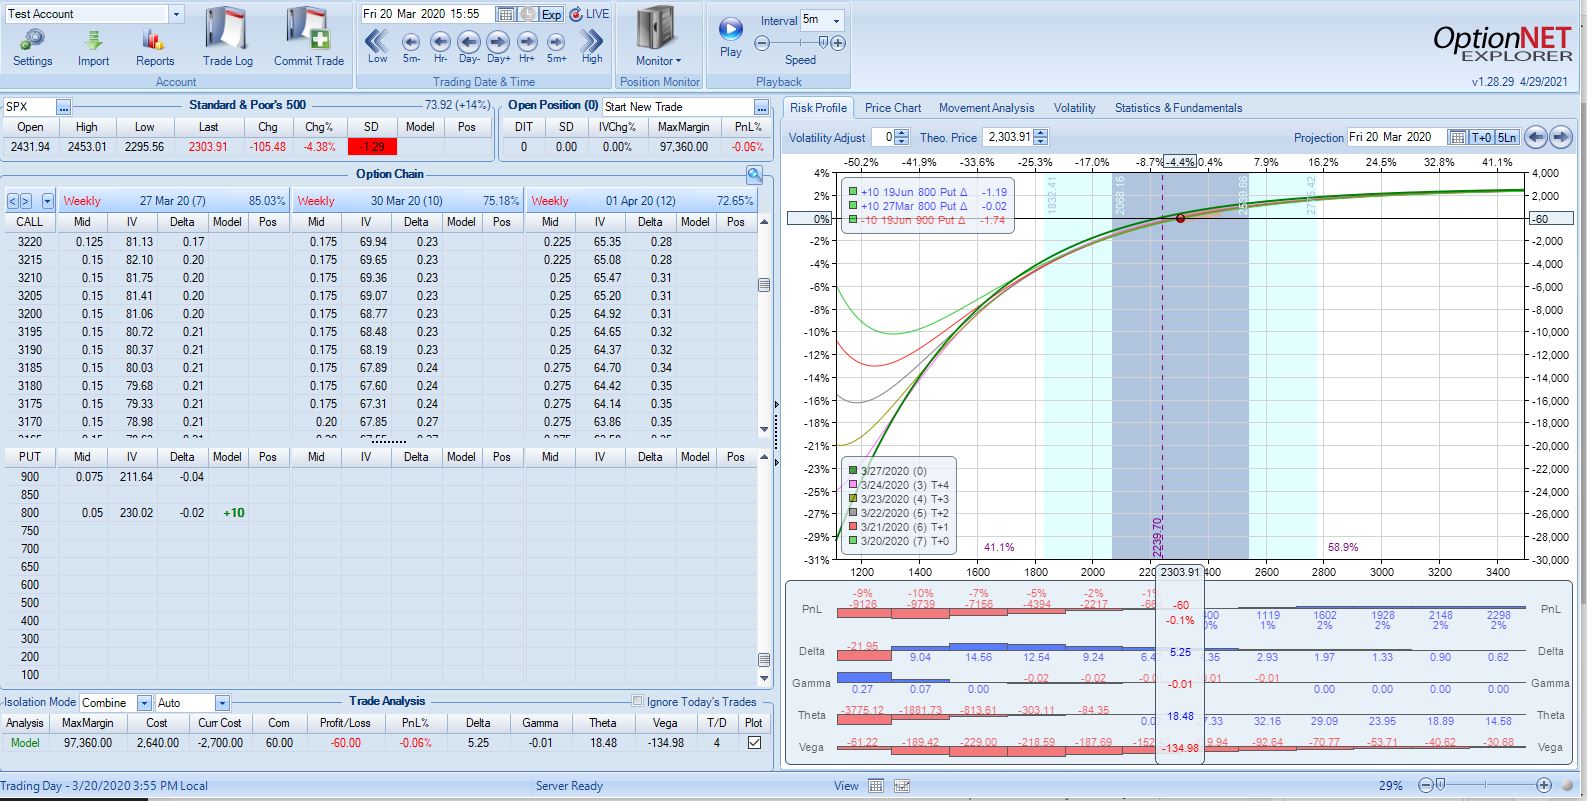
The day steps still slope up and to the left with the lowest value being -20%—and even that is six days from now whereas PM is actually calculated based on today (green curve).
Compare and contrast these last four risk graphs to the first one and we can clearly see the teenies work to protect PM whether purchased above the PCS short strike or [far] below it; the day steps never sink too low no matter how far the market falls. The course makes no mention of managing teenies any differently during backwardation and I no longer see any reason why it should.
I will continue next time.
Categories: Backtesting | Comments (0) | Permalink