Debunking the Williams Hedge (Part 1)
Posted by Mark on July 22, 2021 at 06:41 | Last modified: June 10, 2021 14:21One does not have to look far to find trading courses (or systems) for sale. The advertising pitches are as long as the Mississippi River (or a CVS receipt, at least). I have written about this here and in the second-to-last paragraph here. Today I am going to give a real example of why you might want to avoid purchase of vendor strategies without testing them yourself.*
Submitted for your approval: the case of one Williams Hedge (WH). With name changed to protect the innocent, this is an option hedging strategy sold for ~$300 by a company formed in 2016. The description reads:
> The WH is designed to be a costless way to add crash protection…
> this trade will not help in mild corrective markets… this trade
> will kick in hard in a crash and offer profit to offset losses as
> well as significant margin boost to counteract exploding margin
> requirements and forced liquidations at inopportune times.
>
> [Our company is] an alternative to the hundreds of websites offering…
> index [ICs advertising] 5-10% every month without mention of the
> occasional 80% loss… [the WH is] different… adaptable, robust,
> tested… [we] backtest the idea and rules, then vet the trade plan
> through a small team to tear it apart, then backtest it some more,
> and then create a course for it while we trade it live, and then we
> launch. If it doesn’t perform to spec, we scrap it.
Sounds pretty solid, right?
The WH strategy includes:
- Long-dated put credit spread (PCS) sold for around $0.60
- Short-dated long put (LP) at short PCS strike for $0.45 or less
- 7 DTE teenie for $0.05 as margin control
- Rinse and repeat every week
The video says the far-dated PCS is going to get killed in a market crash while the near-dated LP will explode to offset losses and then some. Gains on the PCS won’t be realized until it closes. During market declines, the overall position will drawdown due to unrealized PCS losses but will recover by expiration assuming the PCS remains OTM.
Parental discretion is advised for the following:
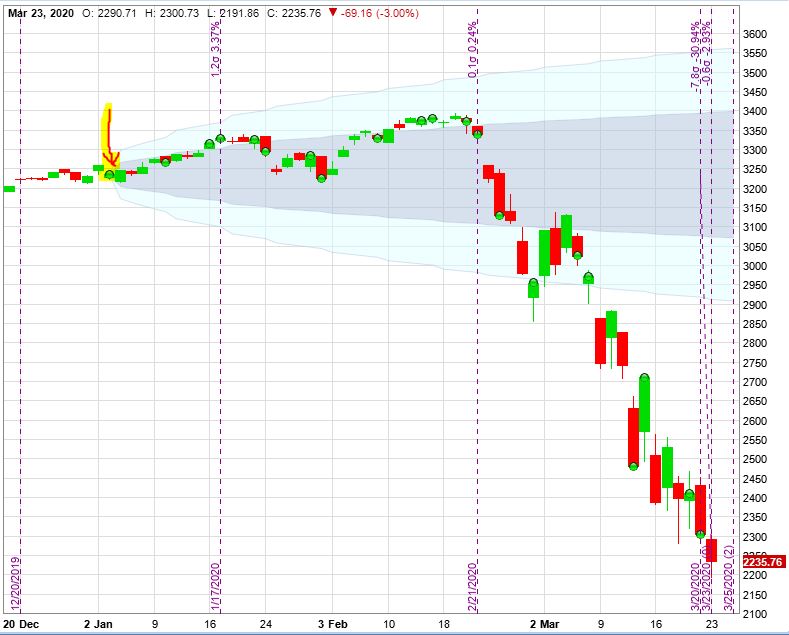
This is an ~32% loss in the S&P 500 (SPX) index in one month. We have isolated a true Black Swan in its natural habitat.
What you are about to see is nothing short of phenomenal:
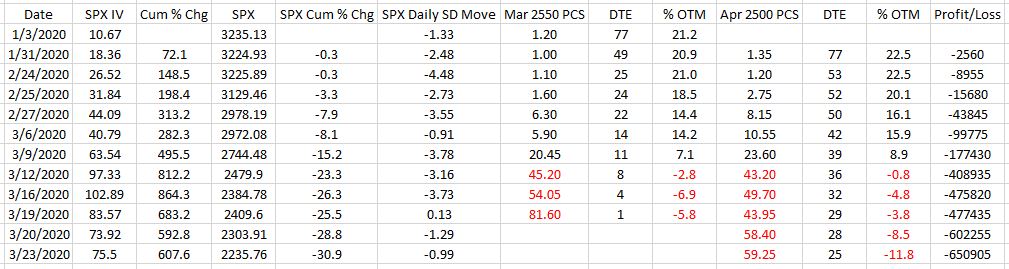
The second row of the table corresponds to the red arrow and highlighting on the chart. The Cum(ulative) % Chg columns use this row as base values for SPX IV and SPX. The three columns of PCS data are spread price, days to expiration, and moneyness. Red values indicate ITM spreads.
I really needed to immerse myself in these numbers for a while to get a good sense of what I’m looking at. SPX falls 30.9% while IV increases ~608%. SPX down 59 points (-1.79%) on 1/31/20 is a 2.48 SD selloff while the 106-point selloff (-4.38%) on 3/20/20 is only 1.29 SD. Realize we’re dealing with IV ~11 in the former case and IV ~74 in the latter.
I will continue next time.
* — See what I did there? Even after payment, many vendors will not be transparent with the
strategy (or coding) much less let you test all the rules yourself. You certainly won’t be
able to fully backtest a strategy before paying for it.