Debunking the Williams Hedge (Part 5)
Posted by Mark on September 10, 2021 at 07:05 | Last modified: June 9, 2021 15:29Today I will continue discussion of the Williams Hedge (WH), which I introduced here.
I left off trying to better understand why the 3/20/20 Difference shown in this table is only 63. This is the second-highest value, but it falls below consecutive 65s that print in a relatively low IV period. I also scratch my head at the third-column 28 [corresponding to Apr 17 800 long put (LP)], which seems extremely high relative to the previous four dates.
Without regard to relevance, I notice delta is a minuscule -0.11 for that Apr 17 800 put. A 100-point move will cause this option to gain only 11 cents without regard to gamma and vega. This seems to represent very little hedging power. Looking back to normal market conditions on Jan 3, I see the LP has delta -0.54. Is this an apples-to-apples comparison?
What would we have to do to find a $0.45 put on Mar 20 with delta closer to -0.50?
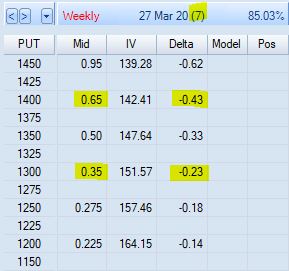
Shortening to 7 DTE, I see the 1300 put listed for $0.35 and a delta of -0.23. The 1400 with a -0.43 delta listed for $0.65 is too expensive per strategy guidelines. Going with any 7 DTE LP results in a Difference of 84, which along with SPX IV would be highest values seen in the backtest. However, I could possibly make the case that no available LP meets the strategy guidelines for Mar 20 without seeing the complete distribution of LP delta values.
The margin-saving LP guideline also seems broken. Recall from Part 1 the weekly purchase of a 7 DTE LP for $0.05. In the last two backtest weeks, 7 DTE puts are only listed $0.05 or less farther OTM than the PCS short strike.
One problem with evaluating quality of the LP hedge by delta value is the corresponding increase in SPX IV. A lower delta for the Mar 20 put is offset by a much higher implied daily move. If the market moves more, then the average daily price change may be similar despite the lower delta. If the low delta is a moot point, then I remain scratching my head at the apparently inconsistent 28 DTE.
One caveat to this analysis is an attempt to be accurate with potentially inaccurate data. For starters, I have a small sample size that probably lacks sufficient power for hypothesis testing. I also question the accuracy of option pricing models in market crash conditions because I have seen loony risk graphs in OptionVue, OptionNet Explorer, and on the TOS platform. Finally, “crash environment” can mean wildly-fluctuating option premiums from moment to moment along with underlying price. I may be attempting the impossible task of using diffuse data to pinpoint small delta differences.
I will continue next time.
Categories: Backtesting | Comments (0) | Permalink