Debunking the Williams Hedge (Part 3)
Posted by Mark on July 30, 2021 at 07:01 | Last modified: June 7, 2021 14:39Today I will continue discussion of the Williams Hedge (WH), which I introduced here.
I mentioned in Part 2 that I would check with OptionNet Explorer (ONE) Support about the IV calculation. He called it a proprietary approximation using option prices “similar but not identical to the VIX style calculation.” That’s all I need to know.
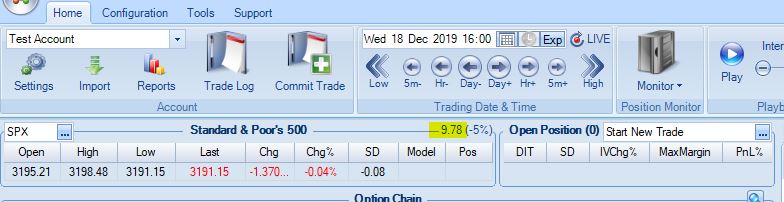
IV % Chg, surprisingly, seems to be a bigger puzzle. ONE Support says this is calculated off the official closing price. As an example, here is a closing screenshot:
Here is the next day at 3:55 PM:
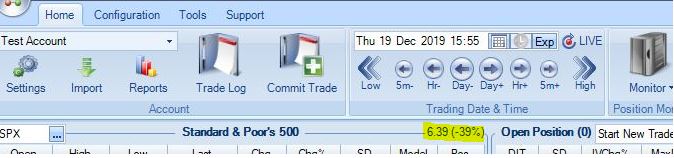
9.78 to 6.39 is a 34.7% decrease yet ONE shows -39%. In case it takes a few minutes for prices to settle to get the official close, I can calculate based on the previous day’s 4:05 PM (9.76) and 4:10 PM (9.79) values. These correspond to IV decreases of 34.5% and 34.7% decreases, respectively. Where does the -39% come from?
I am fine with vendors citing “proprietary methods” in lieu of answering my questions as long as I know what the metric means and that it is consistently calculated. As a basic math fact, percent change is not proprietary and defines one particular correct answer that is not seen above. We still need some clarification.
Speaking of inconsistency, I came back after lunch, powered up the computer, and launched ONE again only to see this displayed for the next day at 3:55 PM:
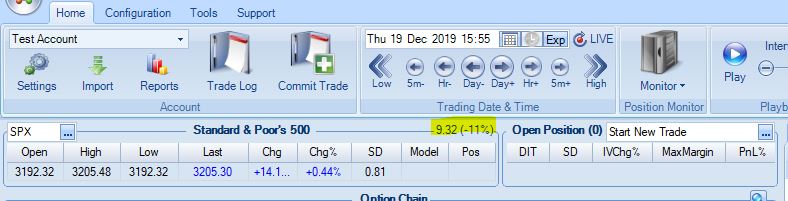
The 9.32 here is much different than the 6.39 seen above. The percent change is also wrong (should be -5%). I still need clarification.
Let’s get back to talking about the WH itself.
Remember the PCS is long-dated while the long puts are short-dated. When the long puts expire, the PCS will remain uncovered. For example, if the PCS average 90 DTE and the long puts average 48 DTE, then vertical spread risk will remain for six weeks (42 days) after the long puts expire. Strategy guidelines dictate closing the verticals for $0.10 when available. Suppose the spreads may be closed for $0.10 with three weeks to expiration. This leaves us uncovered for 90 – (48 + 21) = 21 days or three weeks. During that time, we will have three uncovered PCS tranches. With 10 contracts, this is a potential gross risk of $300K for 100-point vertical spreads.*
The strategy makes no provisions for PCS that go ITM and potentially expire ITM. Theoretically, this is okay assuming the long puts have exploded in value. I did not see this occur in the backtest, though. Why?
The WH video points out that when the market crashes, horizontal term structure can go from contango to backwardation. Aside from negative delta, this contributes to an explosion in long put premium. What is good for puts already purchased in the campaign is bad for puts still to be purchased as a campaign. In order to continue finding high IV puts for $0.45 or less, we will need to go closer and closer to expiration.
I will continue the discussion next time.
* — This was my width for the backtest. I could have gone 75 points wide, which would have
forced selling PCS NTM to recoup the extra cost.