Put Diagonal Backtest (Part 4)
Posted by Mark on October 8, 2021 at 06:41 | Last modified: July 12, 2021 13:54Today I continue with discussion and analysis of my first ever put diagonal backtest.
I left off saying once my short option goes OTM, the only way I can recoup the loss is if the market subsequently crosses below my strike. Once I roll when OTM, intrinsic value is lost…
…for good?
Suppose I roll out to the same strike, market reverses lower, and the option is again ITM at expiration. The LIVOC has now been restored. This is a gamble because equities historically display positive drift by rising more than 50% of the time. The risk is that a small amount of LIVOC becomes a huge amount of LIVOC if the market continues to rally.
Rolling straight out on Mar 23, 2020, for example, could be devastating. This is one of many up days at the start of a huge uptrend covering hundreds of points. Compounding positional losses with the reality of losing big while everyone else is gaining/winning amounts to a double whammy from which psychological recovery could prove extremely difficult. This is directly related to the subject of emotional investing.
If the market seems to be in a downtrend, then I can gamble by rolling OTM rather than ITM. If correct, then I avoid losses that would otherwise result from increased intrinsic value down to the strike price: when intrinsic value starts to build. Again, I call this gambling for the same reason given two paragraphs above.
The struggle is real between rolling to a lower strike and rolling to the same DITM strike for no extrinsic value and potential loss due to slippage. As the market falls and I remain on the fringe of TEV or less, I am tempted to roll down to be more within the meat of the T. Prem distribution (displayed in the second table of Part 3). This would raise more than TEV and prevent me from facing this dilemma repeatedly over subsequent expirations.
In the backtest, I sometimes rolled out 2-3 weekly expirations (4-7 additional days) to capture what seemed like a reasonable average EV. As an example, sometimes rolling out 3 DTE—Friday to Monday—would generate zero EV but 5 DTE—Friday to Wednesday—could be done for $2.20 EV, which is an average of $1.10 over two cycles. If my TEV were $1.00, then I would take that! I hate to lose money due to slippage alone, which argues for rolling down and collecting enough EV to offset.
I would still have to roll higher for the subsequent expiration after a big up day, though, and this represents LIVOC risk.
I will continue next time.
Categories: Backtesting | Comments (0) | PermalinkPut Diagonal Backtest (Part 3)
Posted by Mark on October 5, 2021 at 07:01 | Last modified: June 21, 2021 09:56Today I want to explore roll mechanics and discuss when might be the best time to roll in order to avoid LIVOC (defined here).
The put diagonal aims to collect upward market movement as sold intrinsic value. If we roll lower, then the goal is always to re-establish the high-water strike at some future point without ever incurring LIVOC.
When I started to study this strategy, I thought troubled waters arise for puts OTM at expiration.
I changed my mind in looking at the difference between option premium for ITM vs. OTM strikes. I realized when OTM, I don’t collect much credit when rolling up—certainly much less than the intrinsic value already lost:
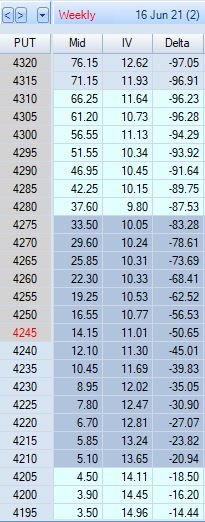
From the bottom, $3.50 to $3.90 is an increase in $0.40 per five point change in strike price. Moving up: $0.60, $0.60, $0.75, $0.85, $0.90, $1.15, $1.50, $1.65, and $2.05 brings us to the 4245 ATM strike. Per five point increase in strike price, the options usually increase much less than half that amount.
ITM premium differentials tell a different story. Going from ATM upward in 5-point increments, we see premium differences of: $2.40, $2.70, $3.05, $3.55, $3.75, $3.90, $4.10, $4.65, $4.70…
I collect closest to $1/point on the roll when DITM, which made me think whether I do the roll with few or many DTE, the essential element is to roll when DITM.
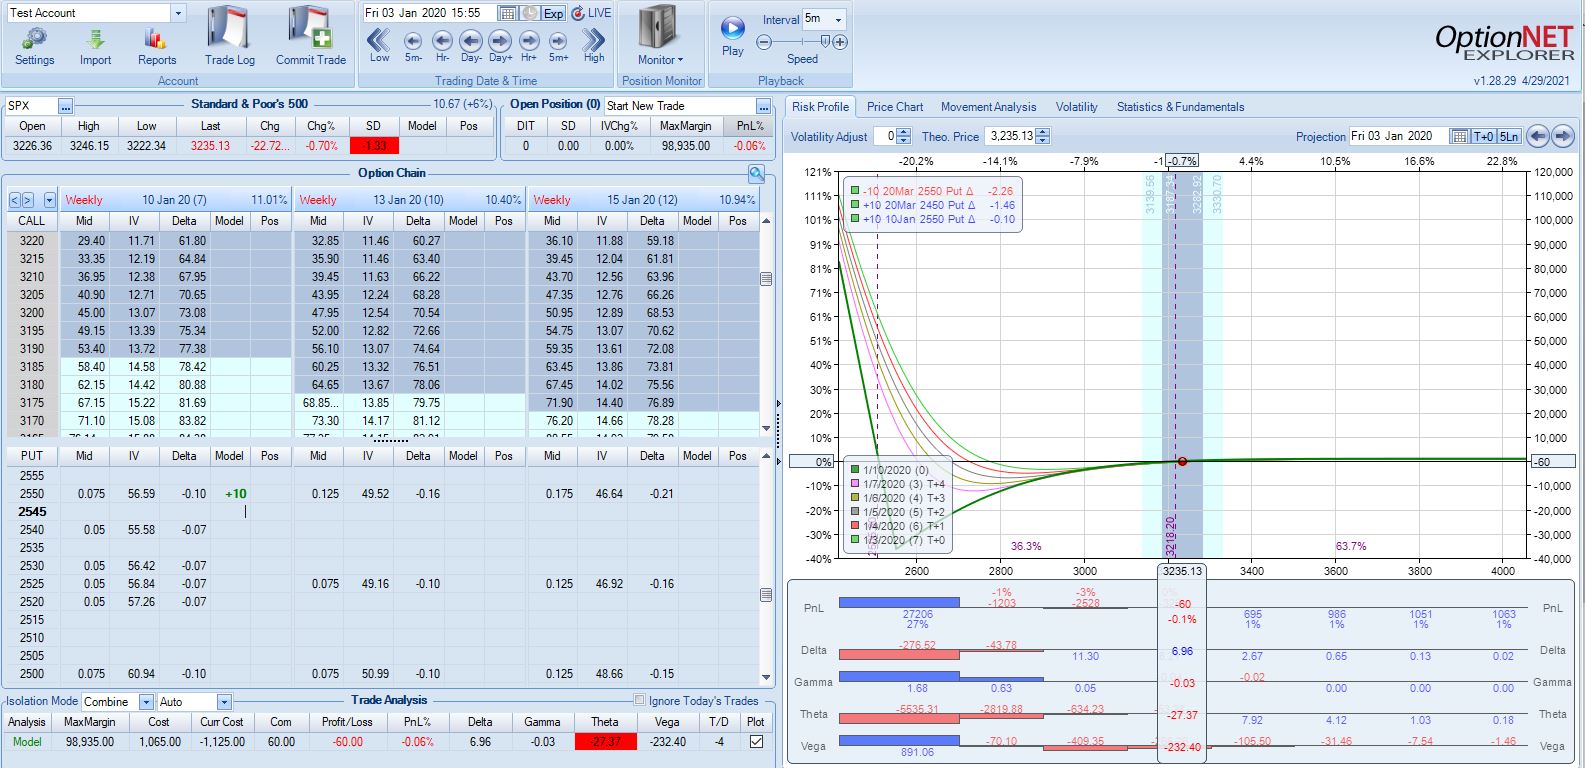
This analysis, however, misses the separate contribution of EV. EV is almost nonexistent near expiration but farther out, it can be seen as [log]normally distributed around the current price. Let’s revisit the option chain with time premium instead of delta displayed in the fourth column:
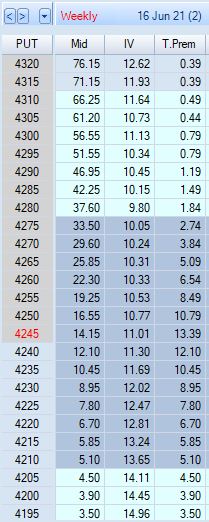
Again, premium differences from one strike to the next are much greater for ITM options than OTM. These differences approach $5, but T.Prem (EV) makes up the difference when less. The $13.39 EV for the ATM strike may be considered a “head start” for premium differences less than $5 as we walk the chain higher. I won’t secure point-for-point value for most rolls, but EV will make up for the shortage.
My current theory is that regardless of when, I want to be sure to roll while the option is ITM (or DITM) in order to avoid LIVOC. The option prices deceive by making higher-delta rolls seem more efficient since premium differentials approach $5. Either way, though, I will have realized point-for-point value for market movement up to my sold strike in addition to any EV the option had at the time I sold anywhere on the chain at expiration when all EV has evaporated. Remaining ITM allows further gains as the market moves higher.
I will continue next time.
Categories: Backtesting | Comments (2) | PermalinkPut Diagonal Backtest (Part 2)
Posted by Mark on September 30, 2021 at 07:00 | Last modified: June 20, 2021 13:37Today I continue with commentary and impressions from my first ever put diagonal backtest.
I left off with mention of selling for greater than TEV in a discretionary manner; this was done for a couple reasons. First, I wanted to offset any additional slippage that might not have been covered by the $0.16/contract. As described in Part 1, this may not have been necessary because I have effectively included $0.32/contract slippage total.* Second, I wanted to offset the occasional overrun, which cannot be avoided (defined below as “LIVOC”).
To give the best chance of realizing fully-financed insurance, TEV should be recalculated after an overrun to make up for lost ground. Efficacy can be calculated once the insurance is closed by subtracting net change in the insurance premium EV from total short-option EV sold. If the difference is zero or positive then I have fully financed the insurance (else I should carry over the deficit to the next contract). The only caveat is that all short options must be held to expiration (EV = zero). If this is not the case, then I must subtract from the total short-option EV any EV paid to close.
This last paragraph may be confusing. Feel free to e-mail with questions if so inclined.
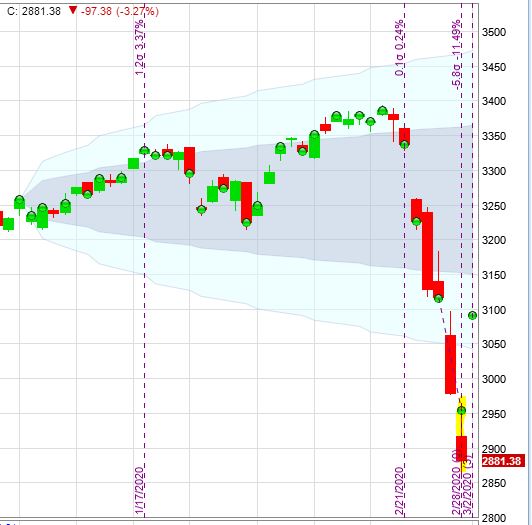
I backtested one contract from Jan 2, 2020, through Jun 16, 2021 (531 days):

The market finished up 29.7% in just under 18 months after being down 31.3% within the first three months. Please excuse the green dots that signify trades.
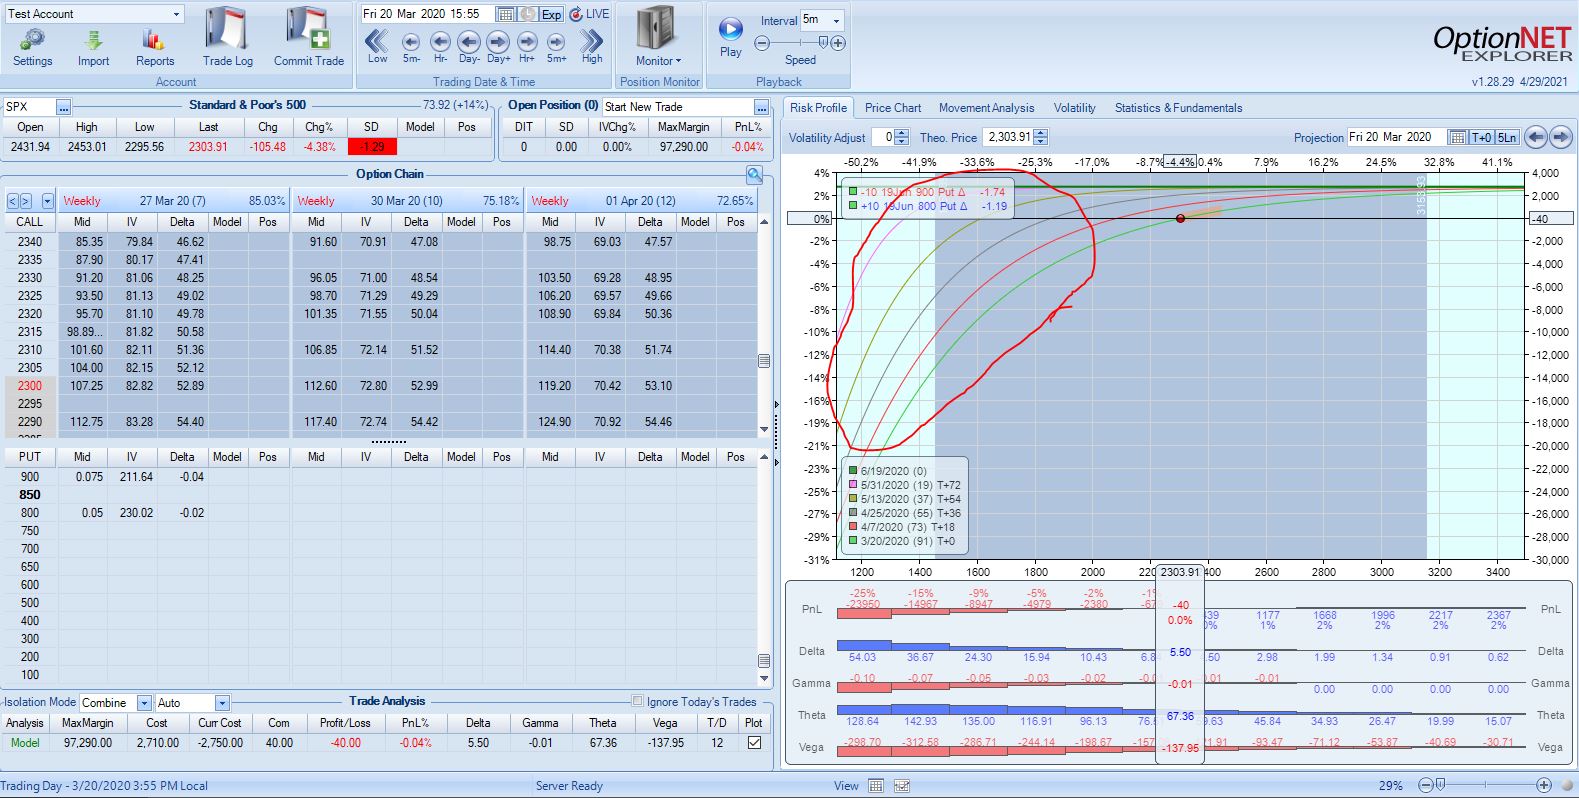
Maximum drawdown (MDD) for the trade occurred on 2/28/20:
Here are some backtesting statistics:
- Initial cost for 3250 put (max value $325,000): $28,678
- MDD: -$9,333 (on 2/28/20, 57 DIT)
- Final PnL: +$127,899
- Market down 8.29 SD (maximum value) at 81 DIT
- Market up 3.17 SD (maximum value) at 529 DIT
One of the bigger challenges in managing this trade is avoiding what I will call Lost Intrinsic Value Opportunity Cost (LIVOC). This occurs when a SP is closed OTM. The option is sold with intrinsic value (the “IV” of LIVOC) that is converted to unrealized gains as the market moves higher [and becomes realized when the position is closed]. Had I sold at a higher strike, the additional upward movement could have been profit as well (the “OC” of LIVOC).
With regard to guideline (4) from Part 1, I feel temptation to lower the strike and collect more EV when EV < TEV: especially with EV ridiculously low (e.g. under ~$0.20). Use caution because underlying market price overtaking the SP strike is what can hurt this trade the most. The LP---hedged by the SP---is vulnerable to upside movement. The hedge runs out soon after going OTM, which occurs once EV is gone. If this occurs, then LIVOC will be realized when closed (and/or at expiration).
I will continue next time.
* — A call has been placed to my broker for confirmation since I have never done this before.
Put Diagonal Backtest (Part 1)
Posted by Mark on September 27, 2021 at 07:38 | Last modified: July 12, 2021 13:43Because the put diagonal fits together in a portfolio with this type of strategy, I spent a couple hours backtesting it. Today I begin discussion of related comments and impressions.
I will start with the strategy guidelines:
- Buy one ATM LEAPS LP in Dec of following year.
- Divide cost by total number of weeks to get TEV.
- Sell ITM put in shortest-term expiration available (M/W/F) at highest strike whose EV > TEV.
- At expiration, roll SP to the higher of strike determined via (3) or strike just closed.
- If the market has rallied 10% from LP purchase then then roll up and out to ATM Dec closest to two years thence.
- If one year has passed since LP purchase then roll LP out to ATM Dec closest to two years thence.
- Execute with midprices and charge $18/contract commission.
My usual approach for dealing with slippage is described in the fifth paragraph here.
In live trading, I regularly deal in options priced $15-$35. I sometimes have to let the trade work for a few minutes, but I usually cave no more than $0.10 for two legs.
The current backtest should factor in more slippage because it:
- Trades options up to $200-$400 in price
- Trades options sufficiently DITM as to have little open interest and virtually no volume
- Includes 2020 crash conditions with fast-moving markets and wider bid/ask spreads to offset price uncertainty
$18/contract, which includes $2 commission and $0.16 slippage, is significantly more than my average realized slippage of under $0.05/contract. Furthermore, I close out each option in the backtest because OptionNet Explorer (ONE) does not have an “Expire Options” button (another issue I have with the software). I am effectively charging $0.32/contract for each short option because in live trading, I could take assignment of ITM options at expiration with no transaction fee whatsoever. I would therefore be saving the $0.16 and, on the rare occasions when options are OTM, the remaining premium as well (ONE usually displays OTM options to be valued at $0.025 just before expiration).
Overall, I think I have done a decent job simulating slippage. I’m a bit light on the LP, but I believe most of these trades would not incur anything close to $0.32/contract. To satisfy the extreme naysayers, I could certainly increase slippage a bit more (e.g. to $0.20) and say “peace!”
I will start to discover the reality when I actually go live. For now, let’s move on.
Despite the guideline defined by (3), I was somewhat discretionary when choosing what strike to sell in the backtest. I sometimes took the fat premiums when IV kicked up and I could still remain seemingly DITM (e.g. 1.5 SD or more).
Why?
I will continue with this dilemma next time.
Categories: Backtesting | Comments (0) | PermalinkDebunking the Williams Hedge (Part 8)
Posted by Mark on September 21, 2021 at 07:27 | Last modified: June 11, 2021 10:40Today I will offer some concluding, miscellaneous remarks about the Williams Hedge (WH), which I introduced here.
The course supports the WH with a very small sample size: Sep/Oct 2008, Jul 2011, and Aug 2015. Why do they not include Nov 2008 when the crash really accelerates? How does it fare through the May 2010 Flash Crash, when Karen Bruton said in an interview she was looking to get tickets to Mexico? One post-production rough market period still available for testing is Feb 2018.* This blog mini-series, of course, has been about the meltdown in March 2020.
As suggested in the fifth paragraph here, I believe there comes a time when the LP hedge should not be purchased at all. Cheap insurance with large potential payout in case of rare disaster makes some sense to me. Expensive insurance with same potential payout in case of rare disaster does not. I mentioned that purchase of the LP at the 800 strike anticipates a market crash of 65% after already crashing 30%. Do I want to spend money trying to protect against that? This is probably an individual decision having to do with risk tolerance.
I definitely think the course is incomplete without any of this being discussed. Backwardation seriously compromises the WH when followed by an increasing number of uncovered PCS tranches as shown in the bottom table of Part 6. To me, the only thing that makes sense about purchasing expensive insurance is margin control (technical term), which I addressed with the teenies last time. I would never expect the teenies to serve as a true hedge by offsetting realized losses.
One caveat to avoiding expensive insurance is to remain protected in case the market actually does go to zero. Being insured 24/7/365 would be marketable to a large segment of the population. I do not believe this is necessary for success, though. I believe “no risk, no reward” has merit and since I have to carry some risk, I might as well carry it in the tail of the tail.
I believe the WH fails in its stated attempt to get LP for free. We do this by financing the LP with cash raised from selling PCS. This works as long as the PCS remain covered. This may not work once the LP start to expire. If backwardation occurs and short-dated puts become relatively expensive, then the LP expire faster leaving more PCS exposed.
The WH is like a Ponzi scheme of sorts: money from one expiration is used to fund costs in another. In a Ponzi, money from new investors is used to cover redemption requests by older. This can continue until many investors come calling at once, in which case money from newer investors is insufficient to cover redemption demand causing the account to go bust.
* — I would expect the PCS not to show much of a drawdown since this was
only ~10%, but I could be wrong because the volatility spike was huge.
Debunking the Williams Hedge (Part 7)
Posted by Mark on September 16, 2021 at 06:40 | Last modified: June 11, 2021 08:21Today I will continue discussion of the Williams Hedge (WH), which I introduced here.
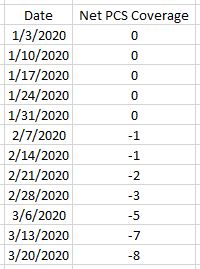
I left off with this table at the bottom that encompasses much of what I have been discussing in the current mini-series. I did not include the 7 DTE $0.05 teenies, which would adjust every value in the table by +1 except for 3/13/20 and 3/20/20 where I did not purchase (see below). Notice how PCS tranches become uncovered as the LP start to expire. Also note how the lack of coverage accelerates after SPX IV goes into backwardation. The course says nothing about this.
In backtesting the WH, I observed when SPX IV got high, I had to go below the PCS short strike to buy the 7 DTE teeny for $0.05. This happened in the last two backtested weeks. Thinking my desired margin control would not be achieved, I skipped the purchase altogether and thought the strategy to be flawed because the course does not address it.
After doing some modeling in OptionNet Explorer (ONE), I realize this was an oversight on my part.
The purpose of these teenies is to protect portfolio margin (PM). I have discussed PM here and here. Basically, the lowest point on the day step curves within +/- 15% (varies by broker) of current market price cannot exceed account net liquidation value.
A PCS risk graph looks like this:
Notice how the day steps, circled in red, all slope down to the left. The position loses more and more money as the market falls. If the loss at 15% down on the underlying is too large, then I will get a margin call from my broker telling me to close positions or deposit more money. This is what we want to avoid.
Below are examples of teenies purchased with 7 DTE at/above PCS short strike in Jan 2020 and Mar 2020:
Notice the day steps slope up to the left and the lowest they fall is -20% for the beige line on the second graph. A loss of 20% is nowhere close to margin call territory. Furthermore, this -20% corresponds to a ~50% market decline (see numbers across top of graph) whereas PM looks down only 15%. The teenies have definitely served their purpose.
Here are the same examples with 7 DTE teenies purchased below the PCS short strike:
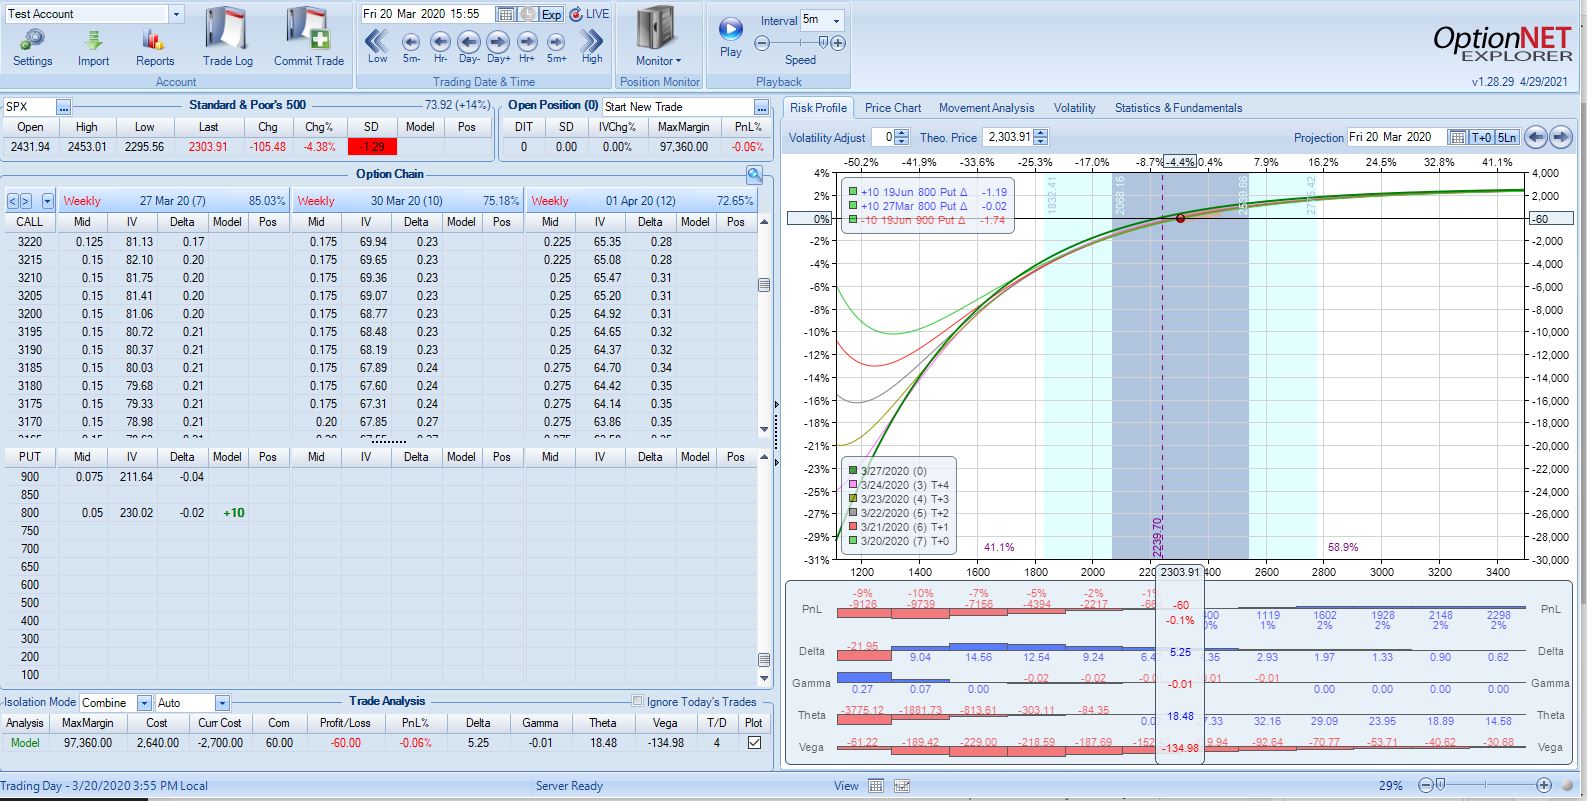
The day steps still slope up and to the left with the lowest value being -20%—and even that is six days from now whereas PM is actually calculated based on today (green curve).
Compare and contrast these last four risk graphs to the first one and we can clearly see the teenies work to protect PM whether purchased above the PCS short strike or [far] below it; the day steps never sink too low no matter how far the market falls. The course makes no mention of managing teenies any differently during backwardation and I no longer see any reason why it should.
I will continue next time.
Categories: Backtesting | Comments (0) | PermalinkDebunking the Williams Hedge (Part 6)
Posted by Mark on September 13, 2021 at 07:01 | Last modified: June 10, 2021 06:39Today I will continue discussion of the Williams Hedge (WH), which I introduced here.
Last time, I did some analysis of small delta differences before realizing multiple reasons to question the accuracy of data. Inaccurate data is not sufficient to support meaningful claims.
Surprisingly, while accuracy may be lacking, at least liquidity should be good. OI on those DOTM contracts is well into the thousands—even five digits in some cases.
To continue the WH campaign in the midst of the 2020 crash conditions is to say “the market has already crashed 30% and it could crash another 44-65% in the next seven days” (for the 1300 and 800 strike, respectively). Nothing like this has ever happened, but that’s not to say it can’t and perhaps someday it actually will.
If you absolutely believe there’s no chance in hell of this happening then you might as well not buy the LP in crash conditions and/or you won’t have the personality to ride out this strategy through crash time.
Some sort of stop could save the WH from catastrophic losses along with the slow bleed from extra LPs. What this does to hedging efficacy when it does actually work would then be the big question.
Getting back to the comparison between SPX IV and Difference, we can clear things up by studying how LP DTE varies when PCS DTE is held constant:
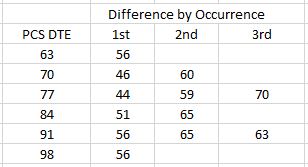
This chronologically groups Difference (PCS DTE minus LP DTE) by DTE occurrence. For each DTE value with multiple occurrences, Difference increases from Jan to Mar.*
As SPX IV skyrockets and term structure goes into backwardation, we see the LP leave greater exposure to the [losing] PCS.
Had I moved everything back one week and sold from 70-105 DTE rather than 63-98 DTE, the spreads would have been a bit farther OTM. The LPs would also have been a bit more OTM and perhaps I could have bought longer-dated LPs to decrease Difference and retain coverage. This is mere speculation, though.
The WH course—once available for ~300 USD—says nothing about changing guidelines in backwardation. The course says nothing about ever having a substantial deficit in PCS coverage. Even worse, they hammer this home with a slide:
Bad, bad, bad. I have shown this to be completely false. Everything I have discussed amounts to this:
I will pick up here next time.
* — This comparison would be a bit more robust had I sold 70 DTE instead of 98 DTE and 91 DTE
instead of 63 DTE since 98 DTE and 63 DTE only occurred one time each.
Debunking the Williams Hedge (Part 5)
Posted by Mark on September 10, 2021 at 07:05 | Last modified: June 9, 2021 15:29Today I will continue discussion of the Williams Hedge (WH), which I introduced here.
I left off trying to better understand why the 3/20/20 Difference shown in this table is only 63. This is the second-highest value, but it falls below consecutive 65s that print in a relatively low IV period. I also scratch my head at the third-column 28 [corresponding to Apr 17 800 long put (LP)], which seems extremely high relative to the previous four dates.
Without regard to relevance, I notice delta is a minuscule -0.11 for that Apr 17 800 put. A 100-point move will cause this option to gain only 11 cents without regard to gamma and vega. This seems to represent very little hedging power. Looking back to normal market conditions on Jan 3, I see the LP has delta -0.54. Is this an apples-to-apples comparison?
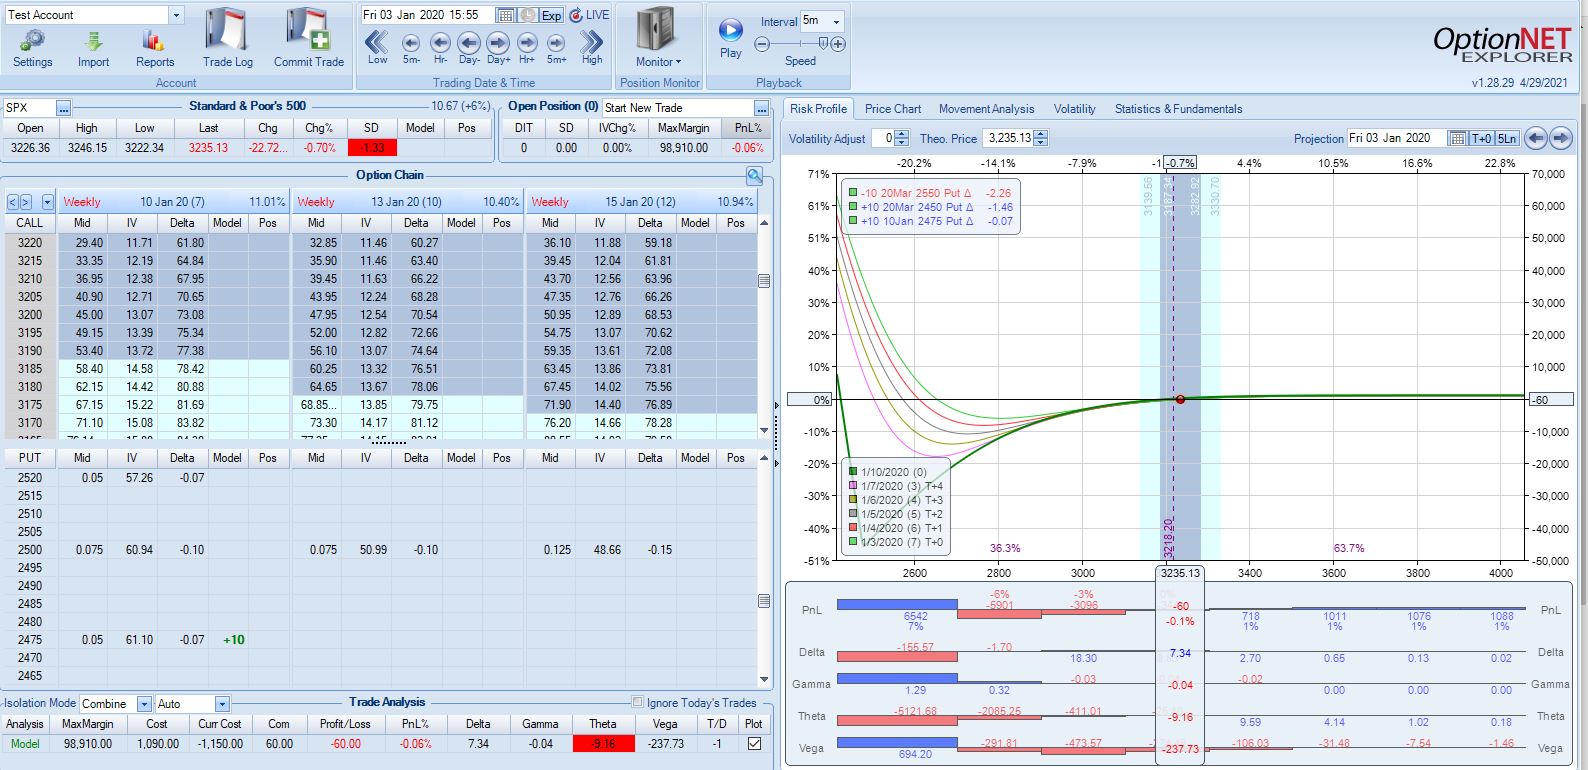
What would we have to do to find a $0.45 put on Mar 20 with delta closer to -0.50?
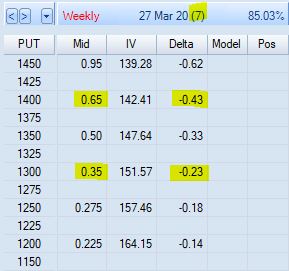
Shortening to 7 DTE, I see the 1300 put listed for $0.35 and a delta of -0.23. The 1400 with a -0.43 delta listed for $0.65 is too expensive per strategy guidelines. Going with any 7 DTE LP results in a Difference of 84, which along with SPX IV would be highest values seen in the backtest. However, I could possibly make the case that no available LP meets the strategy guidelines for Mar 20 without seeing the complete distribution of LP delta values.
The margin-saving LP guideline also seems broken. Recall from Part 1 the weekly purchase of a 7 DTE LP for $0.05. In the last two backtest weeks, 7 DTE puts are only listed $0.05 or less farther OTM than the PCS short strike.
One problem with evaluating quality of the LP hedge by delta value is the corresponding increase in SPX IV. A lower delta for the Mar 20 put is offset by a much higher implied daily move. If the market moves more, then the average daily price change may be similar despite the lower delta. If the low delta is a moot point, then I remain scratching my head at the apparently inconsistent 28 DTE.
One caveat to this analysis is an attempt to be accurate with potentially inaccurate data. For starters, I have a small sample size that probably lacks sufficient power for hypothesis testing. I also question the accuracy of option pricing models in market crash conditions because I have seen loony risk graphs in OptionVue, OptionNet Explorer, and on the TOS platform. Finally, “crash environment” can mean wildly-fluctuating option premiums from moment to moment along with underlying price. I may be attempting the impossible task of using diffuse data to pinpoint small delta differences.
I will continue next time.
Categories: Backtesting | Comments (0) | PermalinkDebunking the Williams Hedge (Part 4)
Posted by Mark on September 7, 2021 at 06:51 | Last modified: June 8, 2021 12:05Today I will continue discussion of the Williams Hedge (WH), which I introduced here.
To better understand the consequences of backwardation, take a look at the following table:
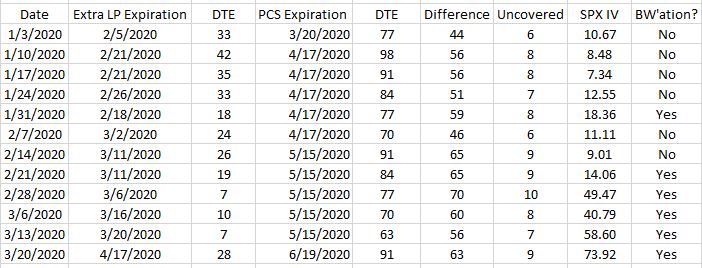
Shown here are the expiration dates of the extra long put (LP) and put credit spread (PCS, in second and fourth columns, respectively) along with days to expiration (third and fifth columns, respectively). “Difference,” in the sixth column, subtracts LP DTE from PCS DTE. “Uncovered” divides Difference by seven and rounds down to convert to number of weeks, which reflects number of uncovered PCS tranches (sold once weekly). The last column indicates backwardation (BW) or lack thereof.
We can see a gradual increase in the Difference column over time. Difference starts out at 44, which is about what I suggested in the fourth-to-last paragraph of Part 3. The first three Difference entries average 52 DTE while the last three average 60 DTE: an increase of eight, which is one additional uncovered tranche.
BW seems to be correlated with higher Difference values. Hypothesis #1: higher SPX IV tends toward BW but is not always coincident with it. To the contrary, the table indicates BW whenever SPX IV > 12.55. Hypothesis #2: increases in SPX IV not corresponding to changes in term structure should not affect Difference as much (if at all). The data seem to support this. Difference ranges from 44 to 65 (56 to 70) for contango (BW). Mean Difference is 53 vs. 62 for contango and BW, respectively. If the 7 DTE LP is selected on Mar 20 (coming attractions), then mean Difference in BW is 66.
This analysis is imperfect partly due to differing granularity of expiration cycles. The long-dated PCS are implemented in monthly expirations, which means shifting expiration contributes +21 or +28 to Difference from one week to the next. The LPs are able to be placed in weekly expirations. When these shift expirations, they do so in a more granular fashion since weekly expirations are available every 1-3 days. This explains apparent discrepancies like why Difference increases from 1/3/20 to 1/10/20 (or 1/17/20) with SPX IV lower (also consistent with my hypothesis #2, above).
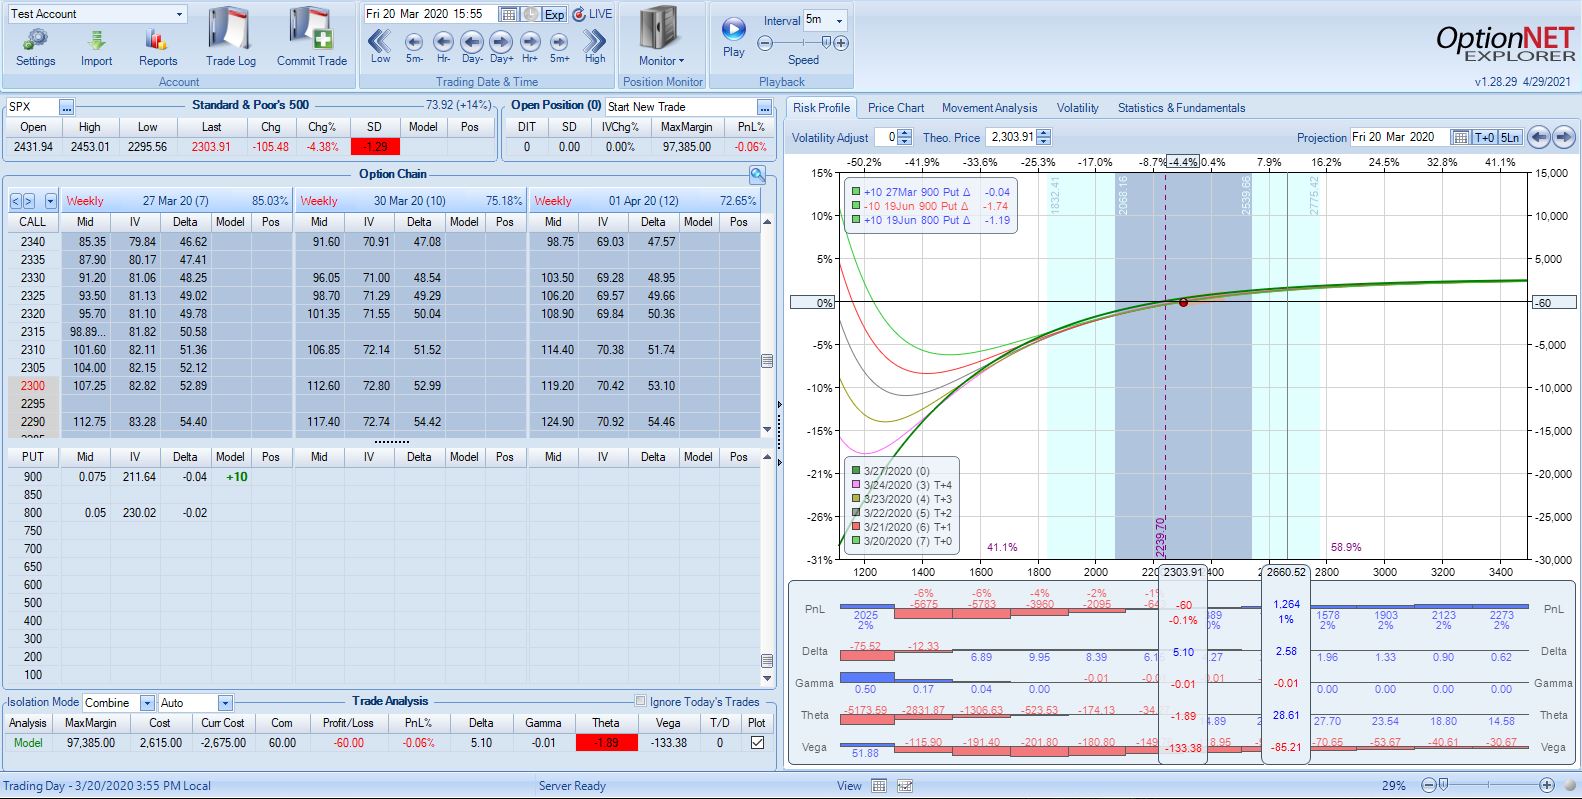
Another reason the analysis is imperfect is outlier vulnerability due to small sample size. The backtest only has 12 data points and Mar 20 may be an outlier. Mar 20 has the highest level of SPX IV. In placing the WH on this day, market crash conditions result in wide bid/ask forcing us NTM to the 800 strike for requisite PCS credit (IV > 105%) after slippage. We then search for the longest-dated put at strike 800 or higher with premium < $0.45 and find the 28 DTE Apr 17 800 put (IV 120%).
Why 28? This even looks out of place in the table where third-column values read 19, 7, 10, 7, 28. The high DTE value results in a Difference of 63. Given SPX IV ~74, why is not larger?
I will continue next time.
Categories: Backtesting | Comments (0) | PermalinkQuestions about CMLViz Trade Machine (Part 3)
Posted by Mark on August 30, 2021 at 09:52 | Last modified: May 30, 2021 18:37I recently viewed a 2019 presentation from Ophir Gottlieb on the CMLViz Trade Machine PRO (TM) automated backtester. Continuing from last time, this is a laundry list of questions, suggestions, and discussion ultimately aimed toward getting clarification about what TM offers and what its limitations are.
I like that TM displays risk on the backtested trades. “Risked” is clickable (look back to the results screenshot in Part 2), and I’ll be curious to see exactly what gets displayed. I want to know the most relevant calculation of “max capital required,” “cost,” or “max risk.” Transparency is important because this will be the basis for total return percentage.
I like that we can select particular start/end dates for the backtest in addition to canned time intervals. I would also like the ability to compare results from the same strategy over different time intervals or different [tweaked] strategy over the same time interval side-by-side on the screen. This was done in the presentation, but I do not think it’s an actual feature.
I appreciate the fact that individual trade results may be viewed and exported to .csv.
I wondered if “pre-earnings” trade could be combined with other option trades like calendar, IC, [long/short] straddle, etc. The answer appears to be yes. Delta values may be specified for different legs and I should be able to incorporate directional biases by setting delta values accordingly. Unfortunately, I did not see the ability to customize percentages (ITM or OTM).
I would like to be able to focus on a particular backtrade and view the option chain as well. This is a premium product and as such, I would hope the data are clean. However, I’ve seen other premium products fail to deliver (see this about OptionNet Explorer). I want to verify option chains are complete and consistent with regard to strike arbitrage, etc.
I like that a low-liquidity warning is displayed when a TM backtest encounters such options; are we able to filter by open interest and/or option volume relative to some customizable average?
Here are some other questions about TM that I was not able to glean from the presentation:
- Can we close trades at X DTE or after Y DIT?
- Can we manage winners at Z% of initial credit or of max potential profit?
- What settings are available for studying 0-4 DTE (Weeklys) trades?
- Can we set max loss exits in terms of delta [relative to initial]?
- Can we apply a customizable IV rank filter?
- Can we apply a customizable VIX filter?
It appears the first bullet above is available as “days.” I would also like to be able to set as a percentage of original DTE for daily backtests or trades triggered by technical criteria (that may occur regardless of DTE).
Daily backtesting is the ability to open a new overlapping position every trading day. This maximizes number of occurrences and enhances trade statistics at the cost of [a] realistic equity curve [statistics]. I addressed serial and overlapping/daily backtesting approaches here and here. For me, lack of this feature would be a major disadvantage.
I did not see the ability to backtest multi-component positions. An example of this is a condor with different entry criteria for the put credit spread vs. the put debit spread, different wing widths for the two, maybe something like a call butterfly and/or another long option added as a hedge, etc. Each component may have its own set of entry/exit criteria but the whole position is maintained or closed based on the net PnL of all components or position net greeks.
Finally, are we able to backtest trades with adjustments? I did not see any examples of this, either.
TM offers a one-month free trial. If the trial includes full functionality, then I can easily answer all these questions.
Categories: Backtesting | Comments (0) | Permalink