Future Content Related to Python Backtester
Posted by Mark on December 2, 2021 at 06:36 | Last modified: September 17, 2021 15:25Although I haven’t blogged in two months, the time has come to give an update on the long-sought-after option backtester.
As it turns out, I met a guy through a trading website who has been programming for decades. He’s a Python expert! He’s had a few different fits and starts with regard to trading and investing over the years, but he recently hit true retirement and thankfully has an interest in working with me to develop the trade backtester about which I have written much in the past.
In the last 18 months, I have taken a closer look at some automated backtesters on the market. In particular, I have researched eDeltaPro, getVolatility, and CMLviz TradeMachine. I did a detailed review about the latter. In coming posts, I will publish my findings on the other two. I really want our backtester to be something beyond what is currently available and to achieve that, we need to identify what has already been done.
This software will not be for commercial use. I am quant- and statistically-minded and looking to combine basic strategies to see how they fit together. The level of complexity will far surpass what introductory traders need. With regard to advanced retail traders out there who have studied and/or possibly developed some of these multifaceted approaches on their own—well, I don’t personally know any, as alluded to in the sixth paragraph here.
I don’t want to start a software company where I would be required to offer tech support.
I don’t really want to be an investment advisor selling my employer’s products.
I don’t really want to go into trader education: that’s a whole other industry of its own and would detract from my main focus.
As mentioned in the third paragraph here, I do want to remain on the quant-related course I have been following.
After reviewing the other two software solutions mentioned above, I will focus on some YouTube content I have been perusing. Videos are available on a wide variety of trading subjects. Some have captured my interest with regard to backtesting methodology. I will analyze these in a manner similar to this lengthy blog series in an attempt to gain a broader perspective on how we may go about backtesting different approaches.
Finally, I will start reviewing some Python concepts that will be integral to the backtester as a way to solidify my own personal understanding of the language.
Coming attractions, y’all!
Categories: Backtesting | Comments (0) | PermalinkSTT Backtesting Notes (Part 2)
Posted by Mark on November 29, 2021 at 07:14 | Last modified: July 15, 2021 12:05I continue with miscellaneous observations from recent STT backtesting done in OptionNet Explorer (ONE):
- I did not use PT or max losses, which would require separate tranche monitoring. I realized afterward that I had not separated tranches by trade ID. This is discouraging because as it was, I had difficulty switching between combined/separate isolation modes and [de]selecting position and/or model for adequate visualization to set up trades.
- I used a global bearish STT for adjustment when technicals turned bearish. Per previous bullet point, monitoring separate tranches is important to roll back or exit tranches by the time short/upper strikes are breached.
- My bias is to save money on debit spreads and to buy only when market conditions turn ugly even though I’ll have to pay more at that time. Although I believe the STT may be a profitable strategy, always-on insurance costs extra. Starting without the debit spreads is essentially trading an income STT. Either way, before hanging tight to this bias I really should give the standard STT a chance to see how it fares without loading the additional credit at inception.
- With or without always-on insurance, I still haven’t quantified exactly how profitable the strategy might be.
- I sometimes lost count of STT and tail-hedge tranches. The idea is to sell an STT every time a tail hedge matures. Upon realizing I had gotten behind with tail hedges, I doubled the number of NPs with the intent to sell one fewer STT upon maturation to catch up.
- The last bullet point suggests additional ONE limitations: not showing total count of long/short contracts, not being able to click on a particular expiration and see statistics for just those contracts, and not being able to click a button to jump straight to farthest-dated contract (as I am able to do with to the shortest-dated). I felt like I needed a separate spreadsheet to monitor current number of contracts and total tranches (and trade IDs) for STT and tail hedge.
- I discovered reverse calendar/diagonals taking shape from extra LPs with NPs in far-dated months after closing NTM/losing STTs. Closing NPs for max loss would avoid SOD risk. Alternatively, I could choose to pay some higher price to force tail-hedge maturity and sell a new STT at the same time.
- Tail hedges are always OTM from STTs themselves and I question their lift strength in this ratio (also see Part 1 comments on convexity). As noted in the third paragraph of Part 1, next time I will buy one month closer (perhaps planning to at least close the embedded STT PCS if necessary when associated tail hedges expire).
- What would happen if debit spreads were purchased one month closer?
- I kept an eye on PMR (down 12-14% on the underlying). I should also monitor LEL at trade inception.
- At one point, I clicked ahead to the next day and was surprised to see a blank risk graph. All positions had expired and the previous months had not given opportunity to sell new STT tranches as tail hedges did not mature. This argues for a supplemental volatility-based or episodic STT entry should market conditions turn bearish (although when the market gets crazy, being totally out isn’t a bad thing; see first bullet point in Part 1).
- The strategy is discretionary with many moving parts and I really don’t know what to track. For this reason, I didn’t keep a spreadsheet and don’t have concrete results to present. This doesn’t sit so well with me.
- Although not implemented in this backtest, I did try to model a couple standard 242s and they seemed nowhere close to delta neutral. I used 25-point strikes and I figure this must have been the result of low delta density. I can always tweak strikes as necessary to change NPD as desired.
I will be doing more backtesting, will hopefully sharpen some of the ill-defined points, and will ideally generate some results to share. Things that might help with this include: PT and max losses, guidelines for UEL and delta bias, clear technical criteria, attention paid to unique Trade IDs, and continuous tracking of inventory.
Easier said than done!
Categories: Backtesting | Comments (0) | PermalinkSTT Backtesting Notes (Part 1)
Posted by Mark on November 26, 2021 at 06:51 | Last modified: July 15, 2021 09:49Today I present miscellaneous notes based on observations seen doing manual STT backtesting in OptionNet Explorer (ONE).
I would like to give a disclaimer about level of sophistication. Someone recently looked at my blog and said, “I was completely lost after two sentences.” I have made particular effort in the past to explain things for an audience unfamiliar with trading concepts. I have cut back on this recently. Please realize my primary motivation for blogging is to organize my thoughts and to keep myself on track with my projects. I don’t need basic definitions because I’m immersed in this stuff every day. Should you have particular questions, always feel free to leave comments below or even contact me via website e-mail.
The backtest begins in Nov 2019 in order to be fully loaded for the March 2020 crash. This is primarily an income STT (BWB) backtested as 10 contracts (five tranches). I hedged starting with nakeds that become 40 LPs upon maturation. I sold the STT in the same month; next time, I will look to sell the STT one month farther out.
I tried to use some rudimentary technical analysis to guide whether I should lean positive or negative NPD. I looked at slope of 50-MA along with IV term structure.
If I’m going to trade this live, then I need to be very clear with technical criteria. Even if the criteria alone do not constitute a profitable strategy, they should at least filter out large contrary moves. I then need to make sure to lean directionally rather than letting NPD grow too large (especially in defensive periods where HV is high and big moves would not surprise).
I charged $20/contract to cover transaction fees. This should be sufficient as discussed here. All expiring contracts were BTC at 3:55 PM. This added expense may be considered to offset crash conditions where larger slippage would be expected.
Here are my general impressions:
- When things get crazy, look to peel back or exit because major adjustments moving around lots of contracts in market crash conditions may not be feasible. I totally forgot about this.
- I was usually short convexity although sometimes T+0 bottomed before reversing higher. I thought the idea with the tail hedge was to generally be long convexity, though.
- While I admit I did not add volatility stress to check convexity, never in 2020 did I see a T+0 smile. Neither was this realized when the underlying tanked despite tail hedges profiting handsomely.
- I did not harvest in this study, which could potentially remove risk for some added cost.
I will continue next time.
Categories: Backtesting | Comments (0) | PermalinkNaked Call Backtest (Part 5)
Posted by Mark on November 5, 2021 at 07:12 | Last modified: July 12, 2021 07:57As mentioned previously, increasing position size makes this profitable: not anything about the naked call strategy itself.
Do any research on Martingale betting systems and you will see they are not recommended. I wrote about this here. The smaller I start as a percentage of the total bankroll, the lower probability I will run into a string of consecutive trades long enough to go bust. Make no mistake, though: it most definitely can happen [and since Mr. Market “can remain irrational longer than you can remain solvent,” it probably will].
What are some ways a strategy like this may be viably implemented?
One way is to position size as a fraction of the entire account. I did calculations in Part 4 based on $240K risk. If this is 10% (for example) of my total account, then I can rest easy because at absolute, never-before-seen worst, I lose 10%.
Another way to trade this responsibly might be to overlay on top of a long strategy that offsets naked call (or vertical spread) losses when the market rallies. Keep in mind that calls are NTM compared to equal-delta puts due to vertical skew, which means portfolio margin requirements can grow faster. Trading fewer call than put contracts as net short premium is one way this can make sense; just remember the number of call contracts may increase at least 16-fold.
Implementation of stop-losses is another avenue for the naked call (or vertical spread) strategy. By improving the avg win:avg loss ratio, I can mitigate position size increases. Stops increase number of losses, though, because a trade cannot recover once it has been closed. Backtesting is needed to better understand whether one factor is clearly more likely to prevail.
Finally, intraday backtesting (discussed in this blog mini-series) remains undiscovered country. Mine is a once-daily backtest,* which allows up to 24 hours for things to go from bad to worse. The worst backtesting loss is on 4/6/20 when a call sold for $1.35 is closed for $45.30. As mentioned in the second-to-last paragraph here, I think ITM short puts are best rolled before they go OTM. The mirror image dictates rolling short calls before they go ITM. Win percentage would decrease, but magnitude of loss would be lower. Again, backtesting is needed to better understand whether one factor is clearly more likely to prevail.
As discussed in the last paragraph here, by rolling rather than taking on some unknown legging risk and leaving short options to expire worthless, the current backtest errs on the side of conservatism. Rolling involves buying out remaining premium and realizing excessive slippage upon exit, which would both be expected to dampen performance slightly.
* — I used market prices at 3:50 PM until Dec 2020 and at 3:45 PM daily thereafter.
This was due only to inadvertent oversight. The catch-22 is to use data as
close to expiration (4:15 PM ET) while not suffering widened, distorted bid/ask
spreads often seen after normal market close (discussed in fifth paragraph here).
Naked Call Backtest (Part 4)
Posted by Mark on November 2, 2021 at 07:14 | Last modified: July 7, 2021 14:31Do you take it or leave it? I say the latter. With a couple changes, though, this trading strategy becomes a bit more enticing.
All of this exempts previously-addressed caveats having to do with dynamic strategy guidelines:
- Use OptionNet Explorer (ONE) between 3/23/2020 – 7/1/2021.
- Sell 10 naked calls in nearest weekly expiration (1 – 4 DTE) for just over $1.00/contract.
- Assess transaction fee of $16/contract for slippage and commission.
- Monitor market and/or trade once daily at 3:50 PM ET (3:45 PM ET starting Dec 2020).
- If ITM, roll to following weekly expiration as far OTM as possible for credit; increase size with discretion.
- Otherwise, rinse and repeat on expiration day with 10 new contracts.
With regard to (2), the target premium is $1.00 but I aim for ~$1.30 – $1.40 to offset transaction fees. If I have to pay material premium to close (e.g. more than $0.05) then I add to target premium in order to net target premium. For example, if I BTC for $0.75, then I will look to sell the next call for ~$2.00.
With regard to (5), I aim to increase size and leave sufficient cushion in case the market continues upward. What constitutes “sufficient” is what makes this discretionary.
Here are the results:
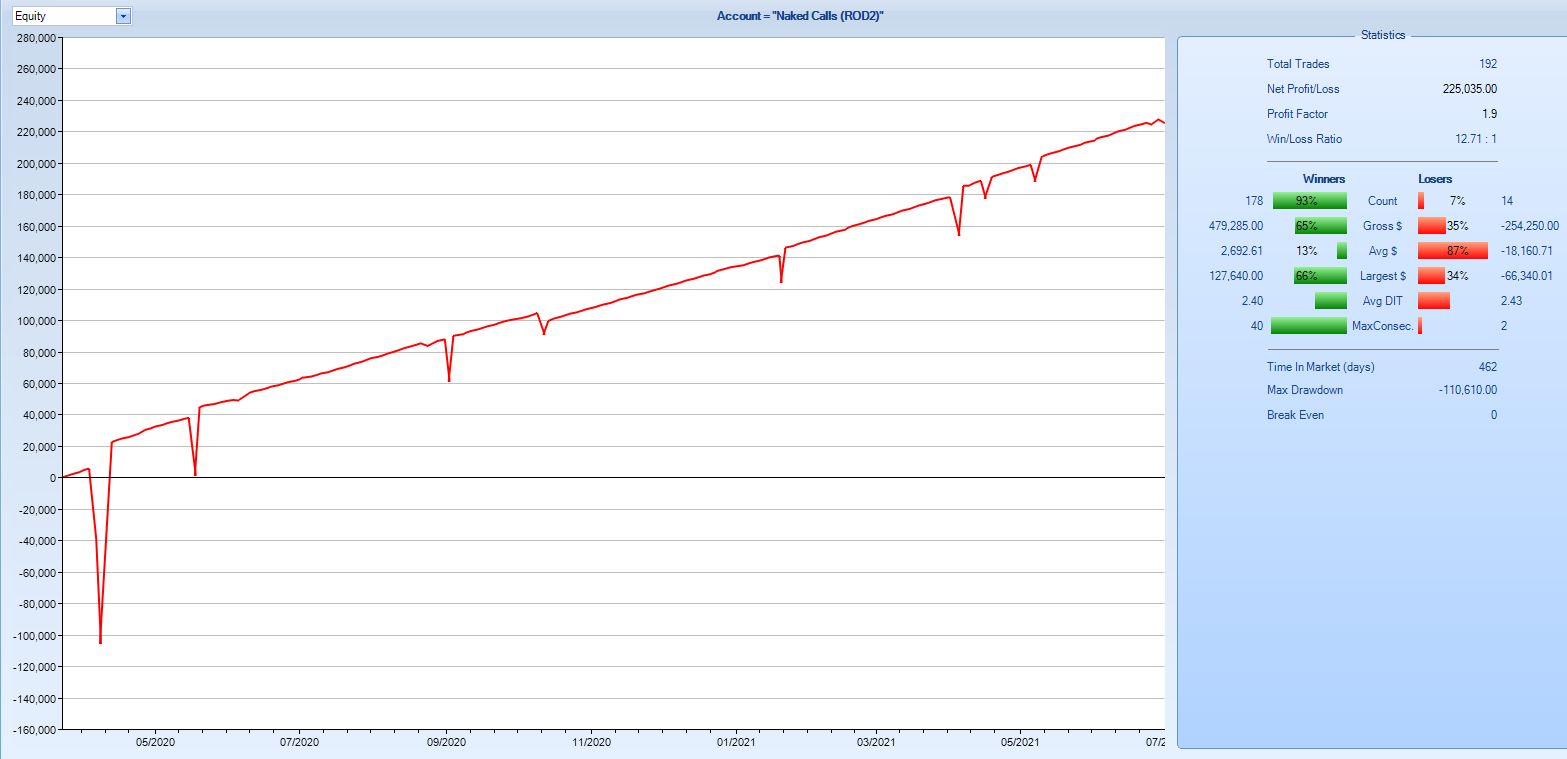
Shocking improvement from Part 1! This equity curve climbs consistently with eight large, brief pullbacks. The average loss is about seven times the average win. While not so great, the strategy wins 93% of the time.
The maximum drawdown (MDD) occurs here:
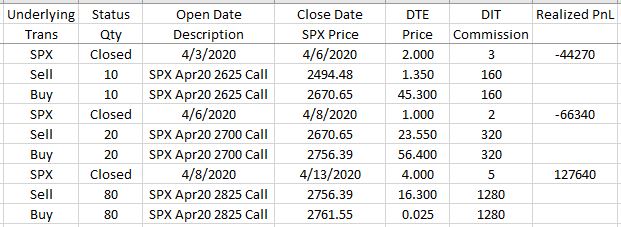
Albeit confusing, SPX price increases 10% from April 3 – 14, 2020. I could have rolled the initial 10 to 40 instead of 20, but I would still have lost a second time and had to roll to 80 contracts. A market pullback allows for a profitable exit.
Is this a viable strategy for live-trading? Follow the logic:
- Contract size increases a maximum of eight-fold (significant improvement from 64-fold seen in Part 1).
- Err conservatively by position sizing for a 16-fold increase (one additional consecutive loss).
- Err conservatively by utilizing a 150-point call credit spread that costs an additional dime.
- Account for spread expense by subtracting ($0.10 + $0.16*) x 192 trades from $22,504 backtesting net profit.
- Max margin $15K/contract * 16 contracts = $240K.
- Net profit ~$17,500 in 16 months (rounding up) is ~5.6% annualized return (rounding down).
Given this may supplement a long portfolio, I am somewhat encouraged especially in comparison to the monthly approach.
Unfortunately, increasing position size is what makes this strategy work—not the strategy itself. When I apply constant position size throughout and add the additional cost to spread off risk, I get a profit factor of 1.03: dismal at best.
But, but… I’ll take any bonus return since I’m trading this sufficiently small to support a 16x increase in position size!
Is it conceivable that we could have more than four consecutive big up periods maybe lasting two weeks or more?
Could I go bust as a result?
Yes. Absolutely.
I will continue next time.
* — This is a very conservative estimate; with the option being $0.10, slippage would actually be half that.
Naked Call Backtest (Part 3)
Posted by Mark on October 28, 2021 at 06:52 | Last modified: July 6, 2021 12:24Before proceeding with more backtesting data, I want to clarify some previous points and make a casual observation.
Position sizing based on max drawdown (DD) says “the largest DD I ever saw in backtesting was X. If I never want more than a Y% DD on my account, then minimum account size is X / (Y / 100).” As an additional margin of safety, suppose the largest future DD will exceed max DD by a factor of Z. The minimum account size becomes (X * Z) / (Y / 100).
Given the $407K MDD (one contract initial size), preference not to see my account down more than 20%, and anticipation of future max DD 2x worse than that seen in the past, minimum account size should be ($407K * 2) / (20 / 100) = $4.07M.
Even if I can position size this way based on max DD, portfolio margin requirements (PMR) could still be a limitation. As account equity decreases and margin limits approach, I may not be able to continue holding the position. Recall from Part 1 that depending on index value, PMR is $1.7M – $3.3M when starting with one contract. A $4.09M account suffering a 40% DD becomes $2.45M, which can no longer support a $3.3M PMR.
DD and position size both determine whether an account can support a position. Position size is proportional to PMR. DD affects buying power. A margin call will be issued by the brokerage as buying power approaches [and certainly slips below] PMR forcing clients to deposit additional funds or to close positions (else the brokerage will do so for them).
Vertical spreads cap PMR, which is still proportional to index price. We probably need to determine the larger of max PM or max DD (along with associated fudge factors discussed in second paragraph) and base position sizing off that.
Large variance across IV and index price level demands more dynamic guidelines for normalization. This backtest implements a static premium in the face of wide-ranging underlying price and volatility. Implementing a static delta, instead, would allow for a normalized strategy that proportionally self-adjusts over time.* If I were doing spreads, then width could be better defined [dynamically] in terms of index price since a static 200 points is 10% of 2000 and only 5% of 4000.
This can all be confusing, which is why I wrote an entire mini-series on it.
As a final note, this backtest closes all short options no later than 3:50 PM on expiration Thursday. In live trading, the short option can often be left to expire thereby saving premium and transaction fee. A cursory review of current results reveals a difference up to $15K: sizeable, to be sure, but amounting to little more than a rounding error all things considered.
*—Added to my to-do list.
Naked Call Backtest (Part 2)
Posted by Mark on October 25, 2021 at 07:30 | Last modified: July 6, 2021 11:03I left off analyzing naked calls with respect to portfolio margin (PM) and maximum drawdown (MDD).
The strategy could be implemented based on maximum drawdown (MDD), but margin is another clear limitation. Even one contract could require up to $3.3M in PM for ~$108K profit. This paltry 0.34% total return gets even smaller as the index continues to climb. Not worth it!
One thing I could do to decrease PM would be to sell the vertical spread instead of naked call. Going 200 points wide would risk up to $20K/contract. Ten contracts would be up to $200K in PM, but I certainly could not increase 64-fold from there.
The spread concept brings with it some other interesting revelations. The backtest starts in high IV:
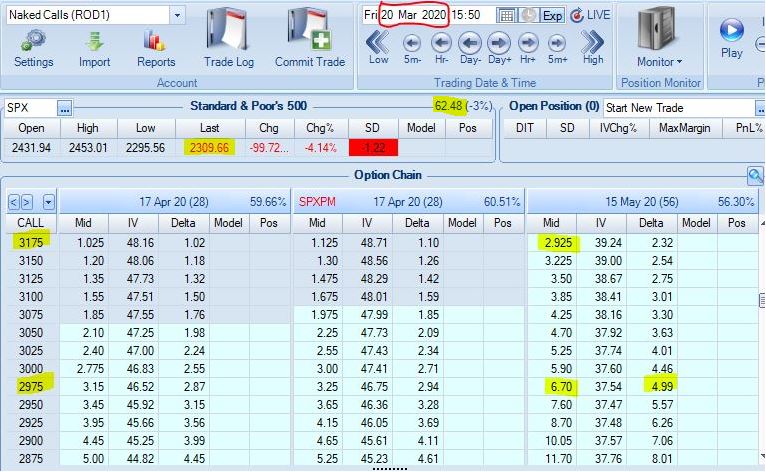
Observations:
- 200 points wide, which is $20K/contract risk
- Net credit ~$3.75 (~$4.40 going one strike NTM)
- Well into second standard deviation (SD) OTM
- Short delta ~5 (~5.6)
The backtest ends in low IV:
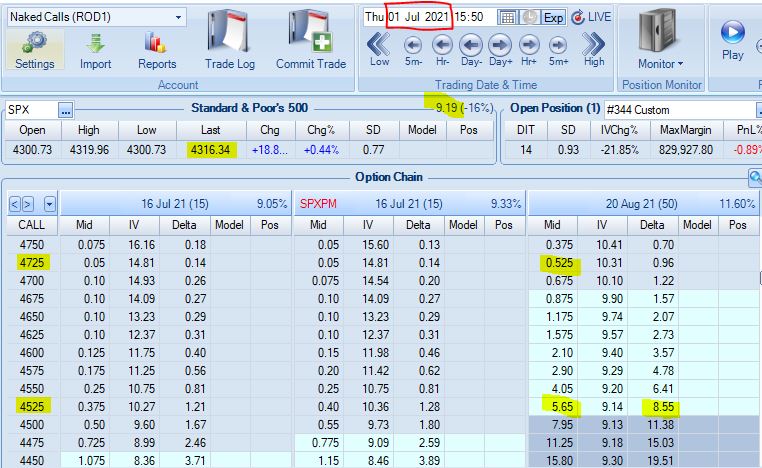
Observations:
- 200 points wide, which is $20K/contract risk
- Net credit just over $5.00 ($7.25 going one strike NTM)
- Just barely into second SD OTM (last strike in first SD OTM)
- Short delta ~8.6 (~11.4)
High IV is lower risk in terms of delta, but generates less credit because the long option is relatively expensive compared to the short. Low IV collects more credit but does so at a relatively higher delta, which is more risky.*
These examples illustrate two major differences: IV and index price. With regard to the latter, selling a fixed dollar amount is relatively NTM (higher delta) for index at lower value compared to relatively OTM (higher delta) for index at higher value.
To see what SPX around 2300 would look like in low IV, we can go back to 12/23/16:
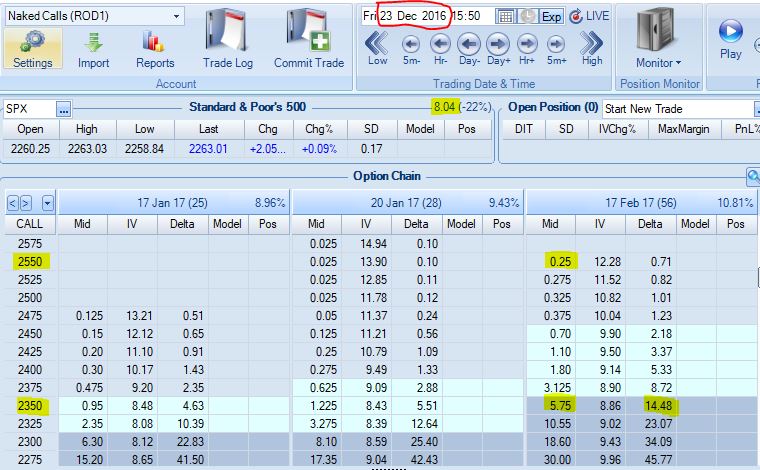
Observations:
- 200 points wide, which is $20K/contract risk
- Net credit $5.50 (~$2.90 going one strike OTM)
- Last strike within first SD OTM (just into second SD)
- Short delta 14.5 (8.7)
The first two examples suggest higher IV may hurt credit, but now we see that lower IV also results in lower credit if sold at a comparable delta value.
Also note that I can cut risk 50% by purchasing the long leg 100 points NTM for only $0.45 more.
I will continue next time.
* — I have discussed two different kinds of risk here. Spread width defines risk as the maximum
loss for any given trade. Delta represents risk by approximating probability of expiring OTM
(full profit) as opposed to ITM (likelihood of loss).
Naked Call Backtest (Part 1)
Posted by Mark on October 19, 2021 at 07:38 | Last modified: July 5, 2021 09:53For the last several years, I have not been a proponent of selling naked calls. However, “necessity is the mother of invention.” Volatility does not explode to the upside; how bad can they actually be?
Here are my backtesting guidelines:
- Use OptionNet Explorer (ONE) between 3/23/2020 – 7/1/2021.
- Sell 10 naked calls in monthly expiration closest to 30 DTE for ~$7/contract.
- Use 25-point strikes only.
- Assess transaction fee of $16/contract (slippage and commission).
- Monitor market once daily at 3:50 PM ET.
- If ITM, roll to following month as far OTM as possible for credit and double size.
- Otherwise, rinse and repeat on expiration day.
This is the backtesting period:
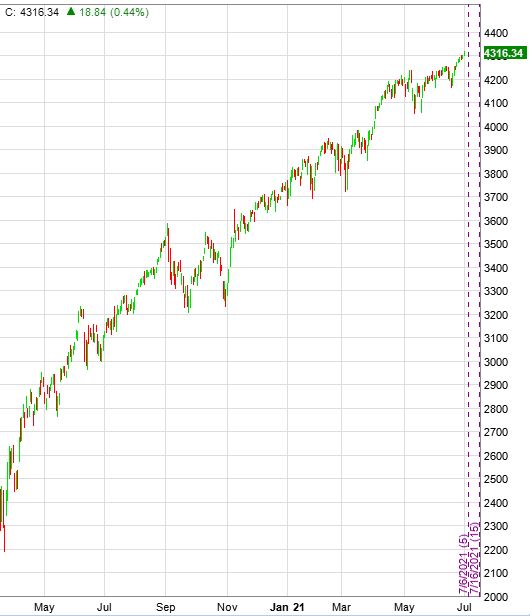
To understand how bad naked calls can possibly be, this seems to be a pretty good place to start. SPX 2254 to 4316 is an increase of ~91% in just over 15 months: a staggering [recovery and] ascent! I expect to see losses under these conditions.
Here are the overall results:
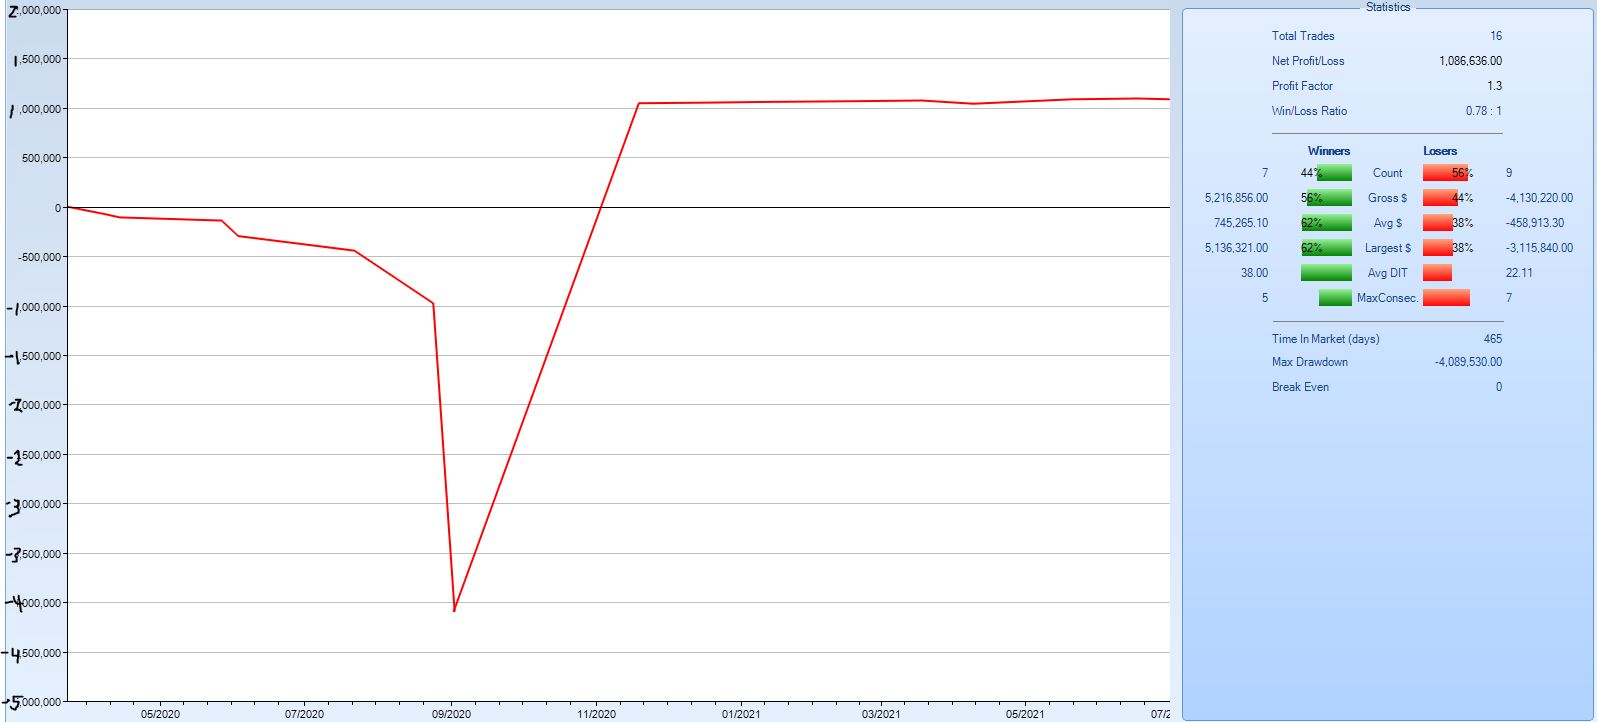
This is a strange looking equity curve. It certainly does not match my ideal, which would be upward sloping at 45 degrees. From inception through Sep 2020, this strategy does a wonderful job losing money. From Nov 2020 on, it looks flat. In between the two periods, it makes a ton of money.
Trade statistics indicate this strategy loses more often than it wins and that the average winner is bigger than the average loser. Overall, this shakes out to a profit factor of 1.3.
Take it or leave it?
Let’s look closer to the individual trade results:
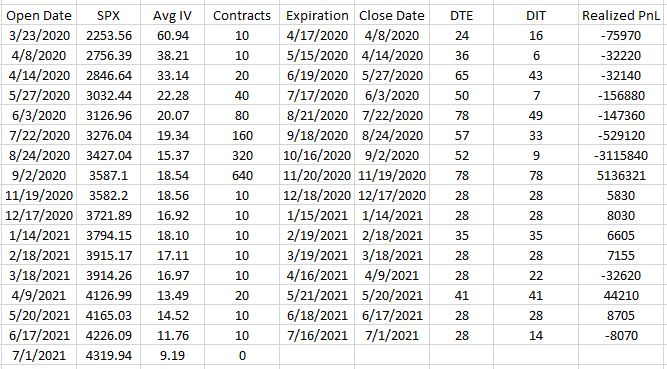
The first seven trades are all losses and position size doubles each time. No wonder the numbers on the equity curve get huge. A win finally recoups all losses and then some. Position size remains comparatively low for the remainder of the backtest (10-20 contracts compared to the high of 640), which is why the curve is flat on the right side.
One trade out of 16 saves our bacon.
Actually, what saves our bacon is not the particular trade but rather the position size. Any of the winning trades sized at 640 contracts would generate enough profit to overcome the losses.
We must not forget about risk. Portfolio margin (PM) for naked calls is 12%. With SPX at 2254, this amounts to 2254 * 100 * 0.12 = $27,048/contract. With SPX at 4316, this amounts to 4316 * 100 * 0.12 = $51,792/contract. The initial position size carries a PM requirement between ~$270K – $518K. 640 contracts carries a PM requirement between ~$17M – $33M where
M = million. This backtest includes a 64-fold increase in position size!
At this point, I have to say leave it. Even with one contract, PM requirements are too large and the MDD ($406K) is too big.
I will continue next time.
Categories: Backtesting | Comments (0) | PermalinkPut Diagonal Backtest (Part 6)
Posted by Mark on October 14, 2021 at 07:35 | Last modified: June 24, 2021 16:54I spent time backtesting yesterday and wanted to make a couple comments before presenting additional data.
First, I did ask my brokerage about this footnote:
> I’m thinking about selling a weekly SPX ITM put and rolling this as a
> campaign. However, rather than close out the expiring SPX ITM put, I
> would just let it get assigned and open the next one. I want to make
> sure this will not incur any fees aside from debiting my account for
> the intrinsic value of the option at expiration.
>
> Can you confirm this?
They responded:
> SPX is cash settled so you would just see a cash credit or debit
> based on the settlement value. There are no commissions/fees for
> exercise/assignment.
This implies I may have overcompensated for slippage as discussed in Part 1. I like to err on the side of caution. Since backtesting has a tendency to artificially inflate results, decisions should be based on conservative projections.
Taking assignment on short options is beneficial. Not only does it allow me to retain maximal extrinsic value, which goes to zero at expiration, it also saves me transaction fees on the buy-to-close.
The potential downside to taking assignment is legging risk. Bid/ask spreads widen at 4:00 PM (normal close) and beyond as mentioned by OptionNet Explorer (ONE) support here. To avoid the wider spreads, I would open the new short position after 3:50 PM knowing the old will expire 25 minutes later. Legging risk refers to the possibility I may lose money due to an underlying price decline. Had I waited until 4:15 PM to open the new short, I would have avoided unrealized loss.
The backtest avoids legging risk by rolling to ensure concomitant execution of both options. “Trade like you backtest” has therefore been violated, which signifies the presence of backtesting inaccuracy.
Legging risk introduces backtesting uncertainty due to data limitations. Because ONE data stops at 3:55 PM, I cannot measure what happens through the 4:15 PM expiration. Over a large sample size, I would expect any gains and losses to average out since I don’t believe any edge exists by consistently going long or short equities from 3:55 PM to 4:15 PM.* Too bad the put diagonal backtest does not encompass a large sample size.
Another source of uncertainty is the remaining extrinsic value I pay to close short options in ONE. I used either 3:30 PM or 3:55 PM in the backtest. Shame on me for not being cognizant and consistently using the latter since time decay accelerates in the last 25 minutes: 3:30 PM includes more extrinsic value than 3:55 PM. This paid extrinsic value represents additional expense that would not exist in live trading, and uncertainty exists because I failed to measure it.
I will conclude next time.
* — This can be tested (make sure to factor in transaction costs).
Put Diagonal Backtest (Part 5)
Posted by Mark on October 11, 2021 at 06:56 | Last modified: June 21, 2021 14:44Just to reiterate, the goal is to stay as far OTM as possible to collect all intrinsic value made available. I will collect the intrinsic value regardless of when I roll unless the market overruns, in which case I start to lose intrinsic value because rolling up will go toward capturing extrinsic until short strike is above the underlying price.
The temptation when DITM with very little extrinsic value being collected is to roll down. Watch out, though, because being overrun can cost us dearly.
The following research question remains: is it more efficient to maintain constant strike price over a series of rolls or can I do just as well if it fluctuates (lower, higher, lower, higher, etc.) within ITM range? If the former is true, then keeping strike price constant and taking the slippage hit (third-to-last paragraph here) would be more plausible. I will backtest this.
As mentioned in this second paragraph, the occasional overrun cannot be avoided. To avoid overruns at all costs, I would have to sell sufficiently DITM that TEV would rarely be attained.
That same sentence implies LIVOC can be recouped by selling additional EV later. As mentioned in Part 2 paragraph 3, amortizing this over the remaining LP life is prudent. I don’t plan to hold LP to expiration due to accelerated time decay. Taking this into consideration along with the up-and-out roll when market rallies 5-10%, perhaps amortization should be done only over the actual duration I hold the LP. This would have to be a retrospective calculation, which means any leftover deficit could be added to the subsequent LP TEV.
How bad can the overrun losses really be? Look at the risk graph below:
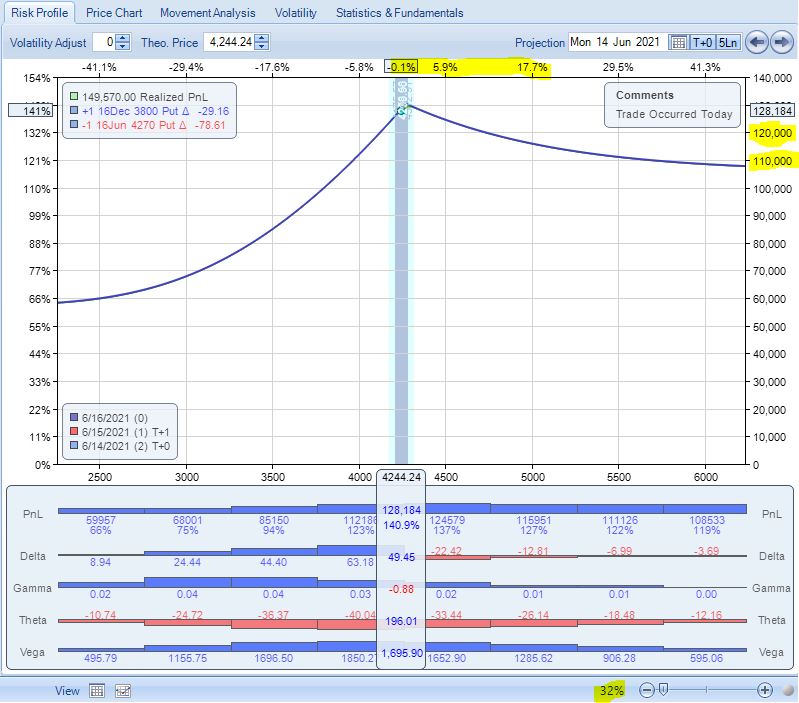
The upside looks pretty dangerous! The highlighted numbers on the right suggest I can lose $10,000 pretty quick, which would be a chunk of the profit accrued to date.
Looking across the top, though, reveals these to be huge changes in the underlying. I should zoom in (note percentage at bottom right) and focus over a more reasonable amount of underlying movement for the next few expirations:
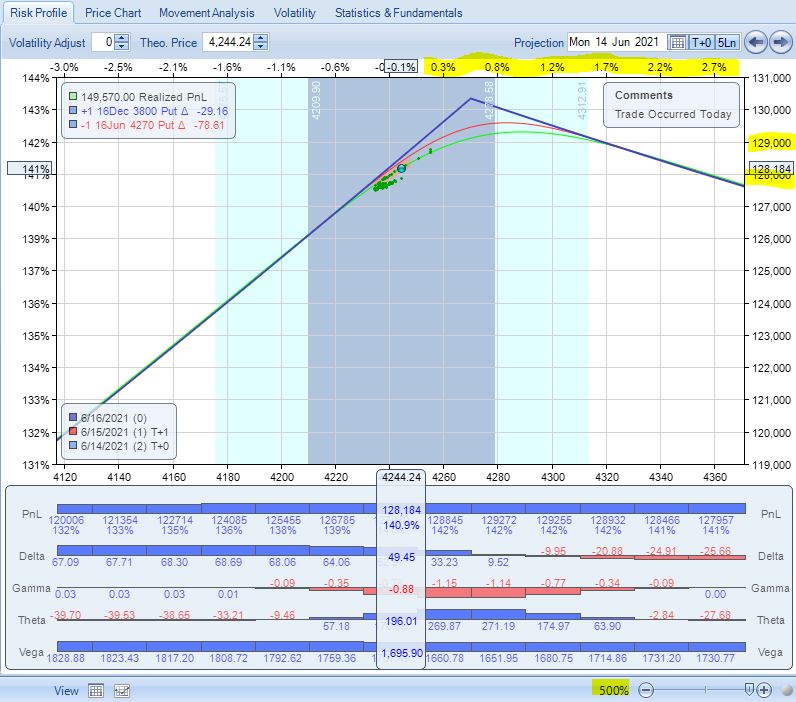
Now I see that even from the peak, I would lose only ~$1,000 on a 3% upside move. This is not catastrophic loss. Let’s keep this in mind before thinking the worst, which I suggested as the “double whammy” in the fifth paragraph of Part 4.
One final backtesting note: on weeks when monthly options expire, be sure to use SPXPM because the monthly expires Friday morning and we don’t want to contend with settlement risk.
Categories: Backtesting | Comments (0) | Permalink