Does Any Technical Analysis Work? (Part 2)
Posted by Mark on November 22, 2019 at 12:06 | Last modified: April 21, 2020 11:39The initial impressions of trading system development discussed last time begs the question about whether technical analysis (TA) is all hoax.
I did an internet search for “do simple technical indicators work” and found some interesting posts.* Here is the first:
> There is no blanket strategy of “TA.” No TA gospel definitively says
> buy/sell when the price crosses the 200-MA. You’re simply looking for some
> pricing pattern that appears in the chart to influence your decision to buy
> or sell, but there are literally an infinite number of pricing patterns.
> Maybe it’s not a 200-MA but a ratio of 200 * (1 minus the index
> increase over that period). People come up with all sorts of weird
> algorithms; some people even find one that will work for a bit. Ultimately,
> it could be anything… [it qualifies as TA] as long as it involves the
> quoted price relative to some historical metric… [emphasis mine] [1]
This argues certain combinations of TA indicators can be developed into profitable trading strategies. Yay!
This also provides some hope for data mining, which is an approach I will discuss in future posts.
Here’s another take that is similar in nature:
> You seem to think “TA…” is some fixed, specific thing… there are a
> hundred different ideas on so-called “TA” and every person who trades
> argues bitterly about different aspects of charting… everyone who
> uses one form of charting assumes that every other charting technique
> is completely stupid. [emphasis mine] [2]
Mention of “hundred” different TA ideas is deceptively small since the actual amount is infinite (see [1] above).
Unfortunately, people posting online engage in name calling, flaming, and trolling. I often see an oozing excess of pride, arrogance, and ego. In the world of statistics and valid trading system development where strategies either pass or fail, I see no reason to get emotional or to passionately defend things. Follow the data and start testing where the data ends.
Out of those commenting online about TA and trading, I wonder what percentage actually has supporting data? Nobody is credible without large sample sizes under their belt and that includes number of strategies tested.
My algorithmic trading journey has just begun with 300 strategies tested. Even were I to have tested 10x that, though:
> …just because YOU haven’t found one that you think works well enough
> to rely on… [doesn’t] mean… [others have]. And when people do, they don’t
> divulge it. If someone had a strategy that worked, it would not be on sale. [3]
Similarly:
> When people figure something out and it’s vital to their own profitability,
> they don’t run around sharing it. Why don’t people understand this? It
> would save a lot of heartaches… [4]
This is a very interesting concept to consider. In other words, don’t expect anything you see, hear, or read to actually work.
Gotta love the smear campaign, too. You can’t say online financial forums lack entertainment!
I’ll continue next time.
* — Online content may or may not be credible. You have to decide for yourself, and this applies to my blog as well.
Categories: System Development | Comments (0) | PermalinkDoes Any Technical Analysis Work? (Part 1)
Posted by Mark on November 19, 2019 at 09:15 | Last modified: April 20, 2020 16:19I went over my second critique of technical analysis (TA) here. My third criticism is that finding a viable TA-based strategy is extremely difficult.
As discussed in this second paragraph, my goal with trading system development is to find viable strategies: not necessarily profitable ones. I will go into more detail about what makes for a viable trading strategy in future posts.
As discussed in the second paragraph here, in order to test strategies I need objective, codable guidelines. Many, but not all, TA-based strategies are this way.
I borrow from Kevin Davey’s approach and define a strategy as a particular code and/or particular time frame and/or particular market. If I take three different codes, for example, and test them on five different markets and two different time frames, then I have studied 3 * 5 * 2 = 30 different strategies.
I have tested nearly 300 strategies on three different markets. I would guess this to be a lot relative to the average trader because most people don’t learn to code, learn to test, or learn to develop strategies. As I discussed in the linked post from the first paragraph, most traders don’t show or provide any data.
Nevertheless, 300 strategies just barely qualifies me as a newbie when it comes to algorithmic trading. I’m not talking about the options work I have been doing for the last several years. I’m talking about my work on futures markets. Thus far, I’ve tested strategies on US equities, on gold, and on crude oil. What has taken me months would take a seasoned quant days (hours?). I am still learning how to code, still finding strategies, and still trying to figure out how I plan to organize all this.
My initial impression thus far is that finding viable trading strategies is really, really difficult.
Many things about the financial industry and trading domain do not surprise me. I’m not surprised by the fraudulent claims. I’m not surprised by the statistical manipulation. The whole debate about whether successful traders actually exist implies not only that something works but also that someone has discovered it. I’ve questioned whether a better way exists somewhere.
In discussing all these topics, I’ve been talking around the issue of viability.
With regard to viability itself, what does surprise me is to fail time after time after time—nearly 300 in all—at my attempt to find it. I have not found any strategies that meet all my criteria. I have not found any strategies that have compelled me to start trading them straight away.
I will continue this discussion next time.
Categories: System Development | Comments (0) | PermalinkCurve Fitting 101 (Part 4)
Posted by Mark on November 14, 2019 at 12:14 | Last modified: April 20, 2020 10:56Before I move forward with trading system development approaches, I want to give one more example of how to curve fit: increasing strategy complexity.
Here’s a basic strategy (in EasyLanguage):
Input: len(14), //optimize 2-20 by 3
offset(40), //optimize 30-45 by 5
pt(500); //optimize 500-2000 by 500
setprofittarget(pt);
if percentR(len) < (50 - offset) then sellshort next bar at market;
if percentR(len) > (50 + offset) then buy next bar at market;
This is a trend-following strategy that will go long (short) when Williams %R is above (below) an extreme value. I am testing extreme %R values of 20 (80), 15 (85), 10 (90), and 5 (95):
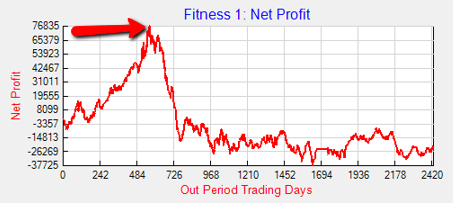
Notice how the strategy performed exceedingly well until the arrow (~500 days in). After that, equity took a precipitous fall and lingered in the doldrums for the remainder of the backtest.
I can improve this by increasing strategy complexity. At the arrow, I will flip from trend following to mean reversion:
if percentR(len) < (50 - offset) then buy next bar at market;
if percentR(len) > (50 + offset) then sellshort next bar at market;
After adding a rule, I can look at the equity curve again. Where I see the beginning of another large drawdown, I will add a subsequent rule to flip back to trend following. I can then look at the equity curve again. Where I see the beginning of another large drawdown, I will add a subsequent rule to flip to mean reversion. Rinse and repeat a few times!
With first four lines of code unchanged, here’s what I ended up with:
If date <= ELDate(11,01,2011) then begin
if percentR(len) < (50 - offset) then sellshort next bar at market;
if percentR(len) > (50 + offset) then buy next bar at market;
end;
If date > ELDate(11,01,2011) and date < ELDate(08,14,2012) then begin
if percentR(len) < (50 - offset) then buy next bar at market;
if percentR(len) > (50 + offset) then sellshort next bar at market;
end;
If date >= ELDate(08,14,2012) and date < ELDate(02,20,2013) then begin
if percentR(len) < (50 - offset) then sellshort next bar at market;
if percentR(len) > (50 + offset) then buy next bar at market;
end;
If date >= ELDate(02,20,2013) and date < ELDate(02,11,2014) then begin
if percentR(len) < (50 - offset) then buy next bar at market;
if percentR(len) > (50 + offset) then sellshort next bar at market;
end;
If date >= ELDate(02,11,2014) and date < ELDate(12,03,2015) then begin
if percentR(len) < (50 - offset) then sellshort next bar at market;
if percentR(len) > (50 + offset) then buy next bar at market;
end;
If date >= ELDate(12,03,2015) and date < ELDate(09,29,2016) then begin
if percentR(len) < (50 - offset) then buy next bar at market;
if percentR(len) > (50 + offset) then sellshort next bar at market;
end;
If date >= ELDate(09,29,2016) and date < ELDate(01,24,2018) then begin
if percentR(len) < (50 - offset) then sellshort next bar at market;
if percentR(len) > (50 + offset) then buy next bar at market;
end;
If date >= ELDate(01,24,2018) then begin
if percentR(len) < (50 - offset) then buy next bar at market;
if percentR(len) > (50 + offset) then sellshort next bar at market;
end;
I increased the number of rules in this strategy from one to eight. The rules couple date ranges with a mean-reversion/trend-following switch.
This is some of the most blatant curve-fitting possible. I’ve used nothing but hindsight, which we know is invalid as a system development technique (see fourth paragraph). Also, recall in Part 2 where I chose a specific parameter value (VIX < 35)? With that approach, I still have to settle for whatever equity curve results. Here, every rule I add directly manipulates the equity curve in whatever direction I so choose.
This is also the epitome of curve fitting because the rules refer to historical date ranges that don’t even exist in the future. Doing so is criminal indeed:
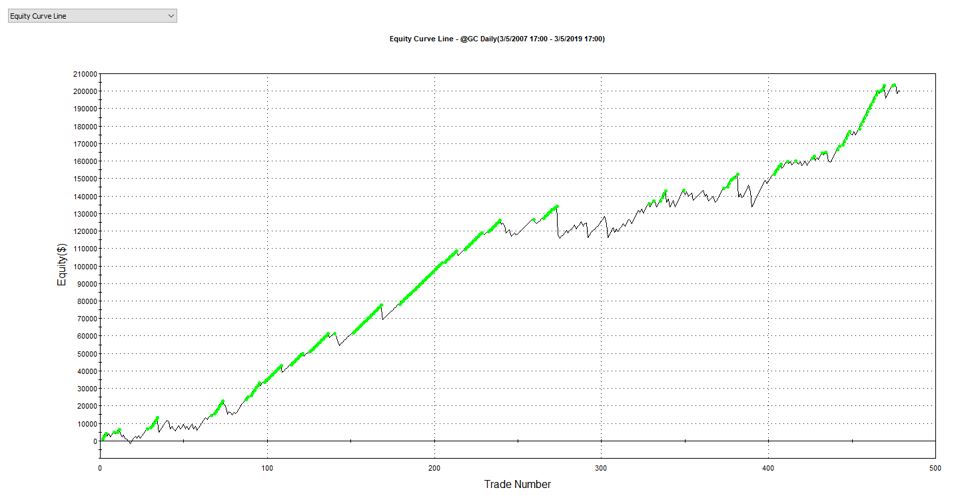
This has 78% winners on 479 trades, a profit factor of 1.71, and trades nearly even with regard to long and short positions (with short trade profit factor of 1.55). Slippage and commissions are included.
The more complicated the strategy, the more beautiful the equity curves. Just remember the more beautiful the equity curve, the less likely it is to be fit to signal rather than noise.
Today’s result is totally, utterly, and absolutely curve-fit. Can’t trade that, folks: no way, no how.
Categories: optionScam.com, System Development | Comments (0) | PermalinkCurve Fitting 101 (Part 3)
Posted by Mark on November 11, 2019 at 07:22 | Last modified: April 18, 2020 14:34Last time, I discussed how specific trade rules may result in curve fitting.
One way to avoid this is to use optimization to explore the surrounding parameter space. When applied as discussed in Part 1, optimization is a bad word. Testing all variable combinations in this manner, however, can be useful as I discussed in paragraphs 4-5 here. Borrowing from this post, look at the following visual:
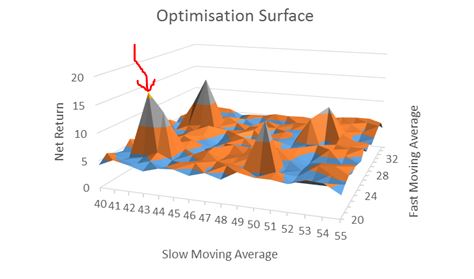
This is a three-dimensional plot with performance (net return) on the z-axis. An optimization may pick the highlighted (red arrow) peak as the best, but if it’s surrounded by losers then the results are probably more fluke (lucky) than due to signal being identified. I would feel much more confident trading a strategy in the middle of a high plateau region where I can choose variables knowing if I am a little off to either side, then I may still have a good chance for good future performance.
Do not use optimization only to choose the best; use optimization as a tool to explore the surrounding parameter space. Test all combinations and survey the landscape. Spikes are bad and high plateau regions are good. The objective is to assess the probability that good performance is not just a matter of random chance.
A standard optimization tests all variable combinations, which are called iterations. Looking back at the plot above, the iterations are ordered pairs along the xy-plane. The total iterations to be tested in a standard (exhaustive) optimization is the product of the number of values each variable can take. The Part 1 strategy had nine iterations: 20 – 100 by 10. Suppose I wanted to add an m-day exit and test exits between 3 – 21 days by an increment of three. Now I have a total of 9 * 7 = 63 iterations to test. If I also add a momentum rule and optimize momentum lookback from 10 – 30 by four, for example, then I have a total of 9 * 7 * 6 = 378 iterations. You can see how fast the iterations add up (especially if I increment by one or two instead of five or 10). This can dramatically impact computer (or especially manual: UGH!) processing time.
Going back to the Part 2 example, if I wanted to incorporate a VIX filter, then I should test different values rather than looking at just 35 (e.g. 20-50 by increments of three) to survey the surrounding parameter space.
Next time, I will discuss one final curve-fitting method.
Categories: System Development | Comments (0) | PermalinkCurve Fitting 101 (Part 2)
Posted by Mark on November 8, 2019 at 06:04 | Last modified: April 18, 2020 10:30In the last post, I gave examples of how optimization could be used to manufacturer an investment newsletter scam. Today, I want to get back to trading system development and give another example of how curve fitting can generate deceptive results.
Also known as overfitting, curve fitting is tailoring a trading strategy to better match historical noise than persistent signal. The strategy may look great in backtesting, but it is unlikely to look good when applied to future data because noise is random.
Besides optimization (see Part 1), a second way to curve fit is to use specific parameter values. Consider a simple strategy that buys pullbacks (in TradeStation’s EasyLanguage):
If C = lowest(C,10) then buy next bar at market;
If barssinceentry >= 3 then sell next bar at market;
This strategy buys after the lowest close in 10 days (bars) and sells after the position has been open for at least three days.
Suppose this strategy suffered its maximum drawdown on the VIX spike over 35 in the 2008-9 financial crisis. Let’s add another rule by changing the first line to:
If C = lowest(C,10) and close of data2 < 35 then buy next bar at market;
Now, the long entry will occur when close is the lowest close in 10 days and when VIX is less than 35. This can improve the equity curve by avoiding a losing trade(s) and going flat in an area that previously experienced drawdown.
The problem here is adding a specific rule to fix a particular past occurrence. It’s like applying a single Band-Aid. A similar event capable of causing significant damage may occur in the future, but the filter may not be effective since we based it on a sample size of 1. Look what happened in February 2018:
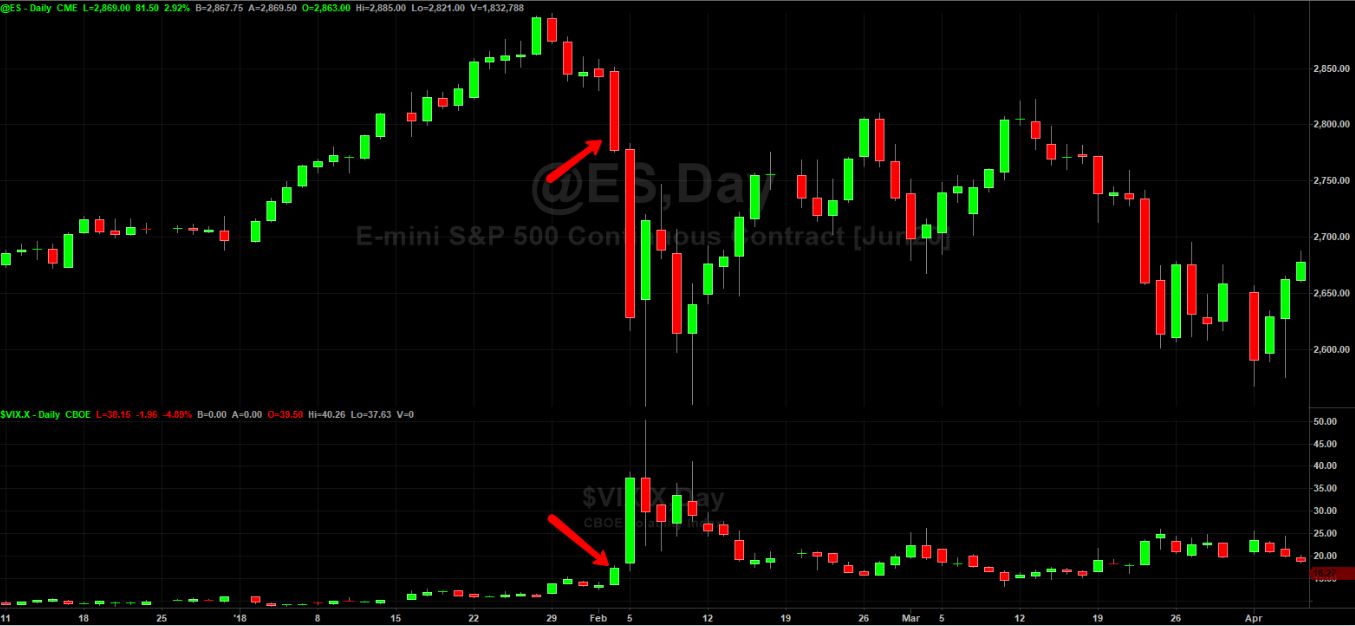
The arrows point to February 2 when ES had a big drop of 2.3% and VIX spiked to 17.31. That was a big move with VIX closing at its highest level in nearly 15 months (11/8/16), but it did not trigger our filter (17.31 < 35). The curve-fit strategy would enter the pullback just in time for February 5, 2018, when the market fell 5.4% and VIX spiked to 37.32. The VIX filter would now be active: one bar too late to serve its purpose. I analyzed a trading strategy that applied this rule here. My curve-fitting comments are in the seventh paragraph.
I will continue the discussion next time.
Categories: optionScam.com, System Development | Comments (0) | Permalink