Curve Fitting 101 (Part 1)
Posted by Mark on October 31, 2019 at 07:50 | Last modified: April 17, 2020 07:49In an effort to explain what not to do, today I go to the dark side with a tutorial on how to curve fit (overfit).
The easiest way to curve fit is through optimization. Wikipedia tells us:
> In mathematics, computer science and economics, an optimization problem
> is the problem of finding the best solution from all feasible solutions.
A standard optimization tests all possible variable combinations. Each one is called an iteration.
Consider a simple trading system:
Buy when price crosses above the x-day moving average;
Sell when price crosses below the x-day moving average.
I can code this into any number of software platforms. This is what it might look like in TradeStation, for example:
Input: MALen(10);
If C > average(C,MALen) then buy next bar at market;
If C < average(C,MALen) then sell next bar at market;
I can then use a tool called the optimizer. The optimizer will backtest a strategy between specified dates. I can input values of MALen for it to test and then I look to see which values performed best.
As an example, I can test between Mar 5, 2009, and Jul 5, 2014. I can optimize moving average length (MALen) from 20 to 100 by 10. This will test nine different iterations: 20, 30, 40, 50, 60, 70, 80, 90, and 100.
The output will be a Strategy Optimization Report. For each iteration, it will give me trade statistics like net profit, gross profit, total trades, % trades profitable—a list of statistics similar (but not identical) to the “standard battery” (second paragraph).
Next, I pick something to be the subjective function (I should have done this first to avoid bias, but it’s all cheating anyway so it really doesn’t matter!), sort that column from highest to lowest, and select the value [of MALen] connected to the best performance. If best performance is a large number then the graph should look pretty good.
Finally, present the best iteration as a strategy I developed. Rather than writing “x” or “MALen,” I just substitute the actual number that led to best performance.
Voila! I have a beautifully curve-fit strategy that I can go out and sell (and hopefully get convicted of some sort of fraud if I really do). Here is our result:
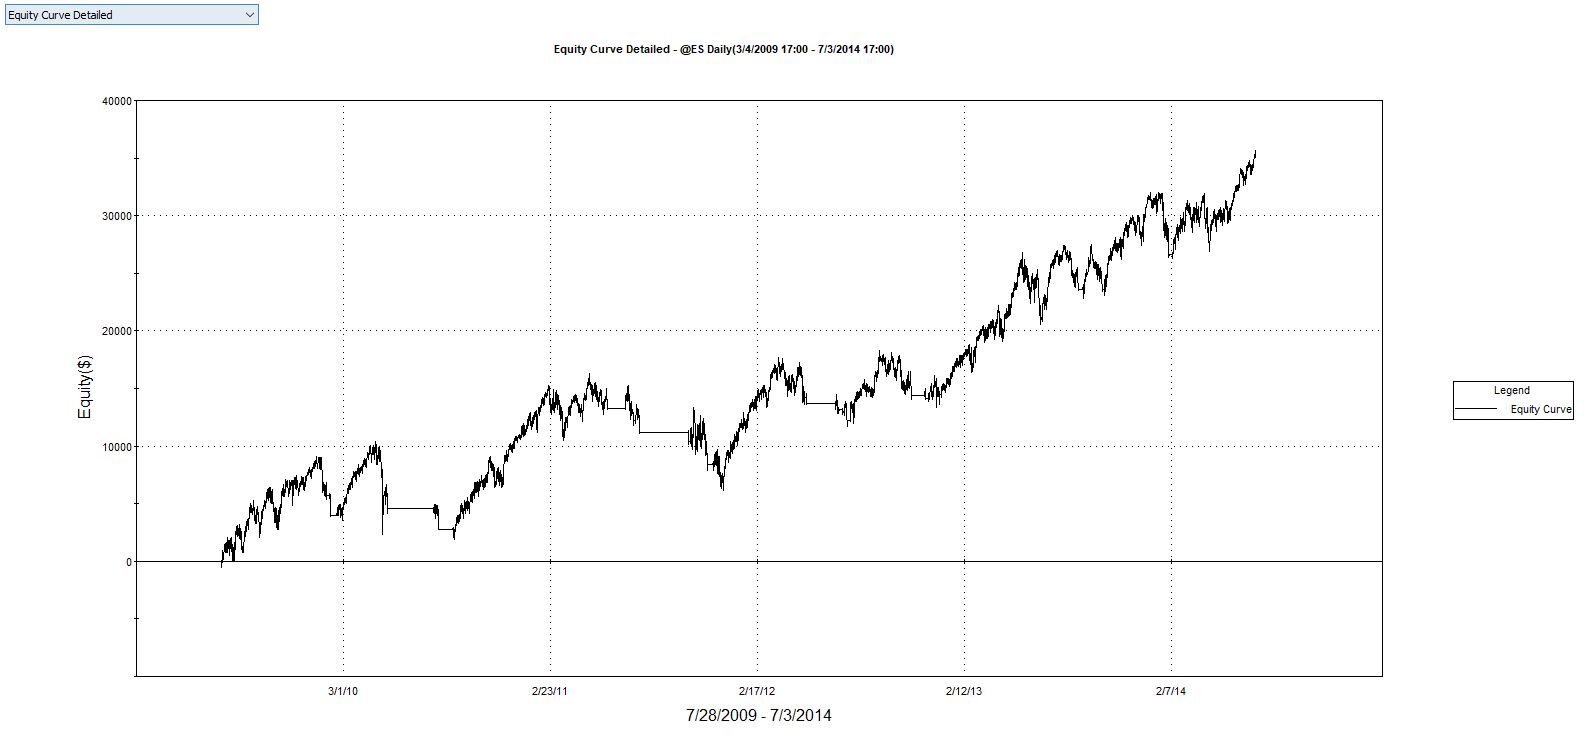
The curve isn’t perfect, but it is pretty darn good with net profit $27,600/contract, average trade $1,105, and profit factor 3.32 on 25 trades over 5 years 4 months.
Oh by the way, I did a couple other things to make this look good:
1. I found a market that performed well (CL, GC not so much).
2. I did not include transaction fees (something I would
3. I adjusted the chart to end on an equity high.
The chances of this strategy performing this well over the next few years (or even months) is tiny. In fact, because of the third bullet point, you don’t even see the large drawdown that immediately afterward.
I will continue next time with more curve-fitting examples.
Categories: optionScam.com, System Development | Comments (0) | PermalinkThe Essence of Trading System Development (Part 2)
Posted by Mark on October 28, 2019 at 06:02 | Last modified: April 16, 2020 16:17Today I continue describing my overall concept of trading system development.
We want to steer clear of overfit models. A model that backtests well and does not perform well going forward is overfit. “Steer clear” means do not trade this strategy. It may also mean abandon further attempts to develop the strategy. There are an infinite number of possible models to test; rather than trying to tweak one that doesn’t work [well] to make it better, toss it and move on to something else.
Trying to tweak a subpar strategy for improvement is a form of curve fitting that can result in overfit models. We can always find a model that better fits historical data by making it more complex.* In mathematics, more terms are added to a polynomial to increase its degree and more closely fit a curve to the data points. In trading, this is done by adding more rules or choosing more specific variable values. The more specific the model, the greater its historical performance and the more curve fit it becomes. Such models are less likely to perform well on future [unseen] data, though, which is why this poses a risk. In this context, “curve fit” is almost like a bad word.
Regardless of what development approach is implemented, I need to be careful not to overfit the model. An overfit strategy will be profitable on historical data while losing money when traded live.
As previously discussed, the signal is constant from some historical date through some future date. Understand the importance of the word some. A viable strategy may profit in live trading… until it doesn’t! Signals change and strategies break. We must constantly monitor our strategies in an attempt to turn them off before catastrophic loss results.
I’ll make one final comment on use of the word “strategy” versus “system.” I mostly agree with my comments from seven years ago. I generally think of “system” to mean the finished product. As I pointed out in the last paragraph, though, it’s never really finished since continuous monitoring should be done to detect if and when it breaks. In the linked post, I said vendors sell “strategies.” I would agree with this because while the developer may regard it as a finished product, for the customer it’s not. First, position size needs to be tailored to the individual using it. Second, each individual should ideally test it for confirmation (rather than taking someone else’s word that it is, in fact, viable). Third, time has passed since the precise completion date [which may not even be given]. We should therefore do further testing to make sure it isn’t broken.
* — I will discuss this in a future post.
Categories: System Development | Comments (0) | PermalinkThe Essence of Trading System Development (Part 1)
Posted by Mark on October 25, 2019 at 10:17 | Last modified: April 16, 2020 12:14Let’s step back and discuss the big picture of how I currently conceptualize trading system development.
In my view, the goal of trading system development is to find viable—not profitable—strategies. Viable means “capable of working successfully,” and while I certainly hope every viable strategy ends up being profitable, system development stops where live trading begins. It may be just semantics and a matter for debate, but I don’t want to hear people claiming to have discovered profitable trading systems that have not actually been traded live. That smacks of optionScam.com since only live trading can reveal whether a system is capable of generating real profits.
I suspect finding strategies that profit in live trading is more difficult than finding viable strategies. I don’t have numbers to support this yet. Either way, I am focused on the latter.
In order to find viable strategies, one needs to have a logical process. I believe I have that now. In fact, I have two mutually exclusive processes that I will talk more about as we go along.
“How to develop trading strategies?” has no single right answer. This seems like the objective function, which I deem to be more subjective in nature. Remember that the development phase aims to give us the confidence required to stick with an unbroken strategy in the face of “normal” drawdowns (as mentioned in the third paragraph of Part 4).
The goal of developing viable strategies is to find a model to fit the signal. A signal is present in both historical price data and future price data. We use historical price data to come up with a model that we hope will match future price data. If this happens, then the equity curve will slope upward to the right and make money. If the model does not fit [whatever ends up as] the future signal, then the equity curve will look ugly and probably lose money.
I try to bias backtests against me since backtested results inevitably turn out to be overly optimistic. I feel strongly that transaction fees (slippage and commission) should always be included (see second and third paragraphs here). Also, for this reason I won’t accept a backtested equity curve that looks fair/good. I want to see excellent because fair/good might end up as poor/fair when traded live.
In trading system development, viable strategies will have a high signal-to-noise ratio (SNR). I mentioned the signal above. Noise is random and therefore different in the past from what it will be in the future. When I find a strategy that backtests well but does not perform going forward, I have created a model that fits noise more than signal. This represents a low SNR. We want the opposite.
I will continue next time.
Categories: System Development | Comments (0) | PermalinkShow Me the Data!
Posted by Mark on October 22, 2019 at 06:40 | Last modified: April 15, 2020 14:13On the surface, technical analysis (TA) seems like a perfect compliment to algorithmic trading. I have three main criticisms, though. The last two posts explained why TA is not always objective. My next critique is the absence of supporting data.
One need not search long to find plenty of articles, blogs, and forums chock-full of people claiming to understand and profit from TA. Lots of trader education programs angle for your dollar, too (also see second-to-last paragraph here).
Despite all the expertise around, I have repeatedly found evidence to back TA missing. How do they know it works? What I’d like to hear is “I tested it.” Even better would be “I tested it and here is the data…” Less acceptable (see third paragraph here), although interesting, would be claims of profitability. Interestingly, I rarely hear this* despite the extent to which people seem to want to gloat, brag, [sell related products] and be followed on social media (see first two paragraphs here).
Show me the data?
My second major criticism of TA is that hardly any data is to be found! For those unwilling to believe others or to accept hollow claims at face value before setting sail in search of trading profits, lack of data is a hard reality. Is this optionScam.com or just a form of “market tuition” we all have to pay on our journey toward consistent profitability in the financial markets? [I would argue the latter]
Perhaps asking for evidence is part of the requisite due diligence for all new traders to better understand the landscape. I can imagine many people never even thinking to ask, though. Hardcore scientists, mathematicians, and statisticians are trained to analyze data critically. Others are not. My undergraduate years were spent amidst scientific literature and research labs, which has probably helped me survive as a full-time retail trader.
As discussed here, I always encourage keeping an eye out for the data. Research or study references should be available in books, articles, or blog posts. For interviews or webinars, people can ask about supporting data if none is given. In personal conversation with people who make TA claims, ask about live trades and ascertain sample size (I always prefer this to be large as mentioned in this fourth paragraph).
Many people ride the TA gravy train and exalt its profit potential. Few people provide hard data to suggest that it works, and this leads right into my third critique of TA, which I will discuss next time.
* — In the rare instance that I do, a further question or two are usually quick to reveal they haven’t
carried out many live trades or anything close to a large sample size.
When Technical Analysis is Not Appropriate for Algorithmic Trading (Part 2)
Posted by Mark on October 17, 2019 at 11:54 | Last modified: April 15, 2020 07:36Technical analysis (TA) is sometimes a bad fit for algorithmic trading. I left off discussing the challenge of using a computer for identification because trendline definition is very subjective.
A corollary to trendline subjectivity is that any price pattern based on trendlines will also be subjective. This includes pennants, flags, wedges, triangles, cup and handles, [inverse] head and shoulders, double tops [bottoms], etc. While all these may look perfect in hindsight, how the trendlines are drawn will determine the [absence of] price patterns seen at the right edge of the chart. The trendlines define trade triggers for breakouts and breakdowns. The “art” of TA is whether to require exacting measures or what fudge factor to use, which will then give rise to multiple ways to draw/view the patterns. What works for one instance may not work for another and in no instances would a computer ever accept such fuzzy logic in the first place.
Subjectivity is not suitable for algorithmic trading. Computers understand true or false with nothing in between. Any number of people studying a suitable algorithmic script should be able to process it in exactly the same way (assuming they all have adequate intelligence to understand its complexity). Objectivity has validity in algorithmic trading: subjectivity dose not. EWT is subjective and invalid. Trendlines are subjective and invalid. Price patterns based on trendlines are subjective and invalid.
Strategies with a future leak—another description of hindsight bias—are invalid. A future leak is when future data is used to make a determination. Imagine going back four weeks and buying or selling depending on what happened two weeks ago. I can do this in backtesting because I have the subsequent data. Things fall apart at the right edge of the chart, though:
“Should I buy or sell today? It depends on what happens two weeks from now.”
That makes no sense! I can’t wait two weeks to decide what to do now because if I wait two weeks, then I’m two weeks late to do what I needed to do in the first place.
As mentioned in this first paragraph, trade like you backtest. If we can’t do that, then we have no valid trading strategy at all.
One of my research ideas is to look at MAE distributions to test for significant differences between large sample sizes. This may be a useful data mining tool (something I will talk about in later posts), but it is not acceptable as a trading strategy because it contains a future leak; MAE can only be calculated once the trade is completed.
Categories: System Development | Comments (0) | PermalinkWhen Technical Analysis is Not Appropriate for Algorithmic Trading (Part 1)
Posted by Mark on October 14, 2019 at 05:12 | Last modified: April 14, 2020 14:53While technical analysis (TA) can be useful, not all TA approaches are amenable to algorithmic trading.
Elliott Wave Theory (EWT) is one such approach that identifies patterns created by impulse waves and corrective waves that oppose the larger trend. This is a fractal approach because each set of waves is nested in a larger set of waves that follow the same impulse-corrective pattern. The problem with EWT is the use of alternate wave labels that remain until the pattern completes. Only the final (correct) labeling remains on the chart. It therefore looks perfect in hindsight every time.
I was once told for every two EWT traders who give opinions, three possible wave profiles will be shown. One review of Advanced Get (EWT software) claims “it always looks great after the move but as the move progresses the software changes the count.”
If we could only trade real accounts this way! optionScam.com anyone?
Distilled into faults, EWT is a form of TA that makes up rules as it goes along, looks perfect in hindsight, and cannot be programmed because the guidelines are equivocal. If the latter were not true, then alternate wave profiles would never appear.
Hindsight bias also pertains to trendlines. Trendlines vary depending on things like time frame, time interval of the whole chart, how many touches the interpreter requires to be valid, and how exact the touches must be. This is not an exhaustive list. Similar to the comment three paragraphs above about EWT, I’ve heard it said many times that you will get x different sets of trendlines drawn for every x traders you gather in a room.
Computers may be programmed to calculate trendlines by matching open/high/low/close (OHLC) values, which are commonly included in historical price databases. We know that one and only one line is defined by any two points. What if three or more collinear OHLC points are required, however (do an internet search for “trendlines require three touches”)? It may be the case that in the last n bars, no lines contain three or more O, H, L, or C’s. A margin of error could be built-in to allow three or more nearly collinear points, but this would likely result in multiple sets of trendlines and a really messed up trading strategy.*
I will continue next time.
* — It might be useful at a later point to explain in detail why I say this is “messed up.”
Categories: System Development | Comments (0) | PermalinkMy Perspective on Algorithmic Trading (Part 4)
Posted by Mark on October 11, 2019 at 11:11 | Last modified: April 14, 2020 06:35I think the biggest disadvantage to algorithmic trading is how difficult it truly is to find viable trading strategies.
This is the thesis I’m working toward, but I won’t get there today. I see much to unpack in the one sentence above.
I believe discussion of “viable trading strategy” can be multifaceted and lengthy with no definitive answer to follow. I’ve done a lot of writing on this topic. I think the blog mini-series starting here is still quite relevant. Another relevant mini-series begins here. At some point, I may review some previous discussion in light of new information I have learned. For now, the bottom line (mentioned in this second paragraph) is that any process used for development must give me the confidence required to stick with an unbroken strategy in the face of “normal” drawdowns.
While having a process to find profitable strategies is one thing, implementing the process successfully is quite another. At first glance, I can find plenty of links that suggest such success is readily available.
Many vendors sell black-box trading systems. These are undisclosed algorithmic strategies that I can purchase (or lease) for use. I won’t find out how they work, but I will be privy to their returns if I allocate capital to them. Some of these have the most compelling sales pitches around.
Black boxes are algorithmic trading systems, but I’m not a fan as mentioned near the end of this post. If a pitch does include backtesting data, then I would want to double-check since backtesting is vulnerable to numerous potential pitfalls (examples reviewed here). Just because performance numbers are printed does not mean they are accurate (and we can almost be certain they aren’t this). If a pitch does not include backtesting data then I would certainly want to test it myself to see how it performs. As black-box systems, I can’t see the code and I therefore can’t backtest them. This is a deal-breaker for me.
Technical analysis (TA) lends itself well to algorithmic trading when it provides unequivocal, programmable rules. I can do an internet search on TA books and find a plethora that have been written on the subject (one of which has made a 9th edition). I can run an internet search on “learn TA” and find information to keep busy for weeks in the form of educational courses, blog posts, podcasts, etc. Many educational services out there advertise teaching trading with TA.
My general criticism of TA breaks down into three main categories. I will discuss these next time.
Categories: System Development | Comments (0) | PermalinkMy Perspective on Algorithmic Trading (Part 3)
Posted by Mark on October 8, 2019 at 11:57 | Last modified: April 13, 2020 15:09Today I will finish discussing advantages to algorithmic trading and then move on to some disadvantages.
Algorithmic trading simplifies portfolio diversification. Automation allows concomitant management of multiple accounts and strategies. This allows risk to be spread across different markets in addition to hedging against losses by establishing low or negative correlation. A computer can scan multiple markets, generate orders, and monitor positions in fractions of a second. The human trader is much slower and can easily make mistakes.
One final advantage to algorithmic trading is the opportunity to manage strategies 24/5. Futures markets are open nearly 24 hours during the week. Computers can execute trades when their human counterparts are sleeping.
Despite all the algorithmic trading benefits I have discussed, it’s important to understand the disadvantages as well.
Like all technology, machines are susceptible to failure. “Install the software, program the rules, and let the computer trade” obscures what is actually a very sophisticated process. When trade orders are stored on personal computer rather than exchange servers, malfunction can prevent orders from being sent. Even slight delays in order transmission can result in discrepancy between theoretical and real trades (the “backtested expectancy” mentioned in this fifth paragraph).
Because technology is not infallible, algorithmic trading requires routine monitoring. I can’t just enter the program, walk away from the computer, check my brokerage account monthly, and expect to see linear growth. Potential problems such as power disruption, internet connectivity issues, and system quirks can result in missing or duplicate orders. Errant orders can also arise due in large part to faulty programming. Especially for the non-professional, slopping coding errors are not uncommon. What’s most worrisome to me is how easily such errors can go unnoticed (a good reason to develop trading strategies in groups as mentioned in the second-to-last paragraph here).
Because technology is not infallible, backups are always prudent. I should have accounts with different brokers in case something goes wrong with one specific account or a brokerage website. I should have a backup computer available in case something breaks. I should have backup power or internet available—or some solution for what to do in case either one fails (e.g. nearest coffee shop or library with free WiFi).
The technology of algorithmic trading has a learning curve. Trade in small size as you become familiar with the process.
Perhaps surprisingly, I think the biggest disadvantage to algorithmic trading is the challenge of finding viable trading strategies. This topic can fill volumes.
I will start next time with a single post.
Categories: System Development | Comments (0) | PermalinkMy Perspective on Algorithmic Trading (Part 2)
Posted by Mark on October 3, 2019 at 11:10 | Last modified: April 13, 2020 14:38Today I want to continue by discussing some advantages to algorithmic trading.
The first advantage to algorithmic trading is automated backtesting. Backtesting assesses the viability of strategies by applying them to historical market data. While past performance is no guarantee of future results, strategies that perform poorly in the past are not typically recommended for live trading (see third paragraph). Backtesting requires trade guidelines to be unequivocal with regard to interpretation as the computer does not make guesses. Once programmed, historical backtesting takes seconds to minutes whereas manual backtesting [especially of discretionary, fuzzy strategies] can take weeks to months. Backtesting helps to fine-tune strategies or reject them outright by creating reasonable expectations for future returns.
A second advantage to algorithmic trading is emotional control. Individuals prone to overtrading are better served by a machine. Individuals scared to “pull the trigger” are better served by a machine. The human tendency to question trades can lead to delayed execution. Because algorithms execute automatically without emotional interference, algorithmic trading solidifies adherence to trade guidelines.
This is to say that managing emotion preserves trade discipline. Discipline may also be compromised by fear of losing or desire to squeeze out more profit from a trade. Algorithmic discipline reigns over even volatile markets.
“Plan the trade and trade the plan”—one of the most difficult tasks for traders to achieve—is embodied by algorithmic trading. Following trade rules precisely (neutralizing emotional influence) is the only way for backtested expectancy to be meaningful. Ruined confidence by consecutive losses jeopardizes this by causing trade delays. Since neither fear nor confidence apply to computers, strategies be executed flawlessly regardless of previous trade outcomes.
A third advantage to algorithmic trading is speed of order entry. What takes seconds to minutes for a person when pointing, clicking, and typing in multiple cells, radio buttons, or dropdowns is handled in milliseconds with a computer. Seconds (or worse) can make big differences in trade outcome especially when backtested expectancy assumes zero latency. Computers respond immediately to changing market conditions and are able to generate orders once trade criteria are met. Alerts need not be set or monitored. Exit orders are instantly generated.
With algorithmic trading, I will never have a trade retrace from a profit target or blow past a stop-loss level before I can an order to properly exit.
One other thing that will not happen with algorithmic trading is “fat finger” mistakes. This occurs when a trade is entered incorrectly (e.g. buy instead of sell, 10 contracts instead of 100, wrong symbol, etc.).
I will continue next time.
Categories: System Development | Comments (0) | Permalink