Curve Fitting 101 (Part 1)
Posted by Mark on October 31, 2019 at 07:50 | Last modified: April 17, 2020 07:49In an effort to explain what not to do, today I go to the dark side with a tutorial on how to curve fit (overfit).
The easiest way to curve fit is through optimization. Wikipedia tells us:
> In mathematics, computer science and economics, an optimization problem
> is the problem of finding the best solution from all feasible solutions.
A standard optimization tests all possible variable combinations. Each one is called an iteration.
Consider a simple trading system:
Buy when price crosses above the x-day moving average;
Sell when price crosses below the x-day moving average.
I can code this into any number of software platforms. This is what it might look like in TradeStation, for example:
Input: MALen(10);
If C > average(C,MALen) then buy next bar at market;
If C < average(C,MALen) then sell next bar at market;
I can then use a tool called the optimizer. The optimizer will backtest a strategy between specified dates. I can input values of MALen for it to test and then I look to see which values performed best.
As an example, I can test between Mar 5, 2009, and Jul 5, 2014. I can optimize moving average length (MALen) from 20 to 100 by 10. This will test nine different iterations: 20, 30, 40, 50, 60, 70, 80, 90, and 100.
The output will be a Strategy Optimization Report. For each iteration, it will give me trade statistics like net profit, gross profit, total trades, % trades profitable—a list of statistics similar (but not identical) to the “standard battery” (second paragraph).
Next, I pick something to be the subjective function (I should have done this first to avoid bias, but it’s all cheating anyway so it really doesn’t matter!), sort that column from highest to lowest, and select the value [of MALen] connected to the best performance. If best performance is a large number then the graph should look pretty good.
Finally, present the best iteration as a strategy I developed. Rather than writing “x” or “MALen,” I just substitute the actual number that led to best performance.
Voila! I have a beautifully curve-fit strategy that I can go out and sell (and hopefully get convicted of some sort of fraud if I really do). Here is our result:
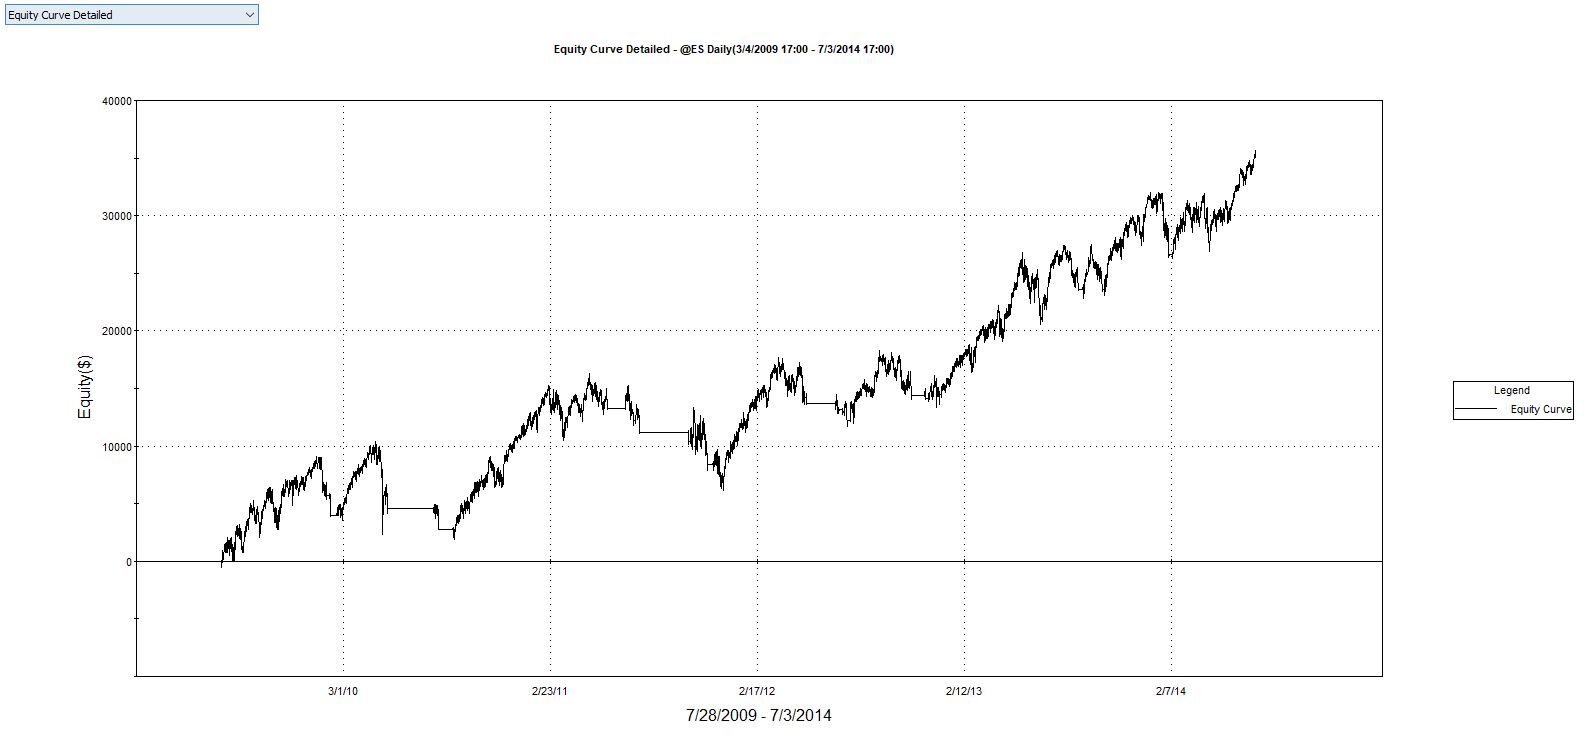
The curve isn’t perfect, but it is pretty darn good with net profit $27,600/contract, average trade $1,105, and profit factor 3.32 on 25 trades over 5 years 4 months.
Oh by the way, I did a couple other things to make this look good:
1. I found a market that performed well (CL, GC not so much).
2. I did not include transaction fees (something I would
3. I adjusted the chart to end on an equity high.
The chances of this strategy performing this well over the next few years (or even months) is tiny. In fact, because of the third bullet point, you don’t even see the large drawdown that immediately afterward.
I will continue next time with more curve-fitting examples.